- Chiliz price frustrates bulls as head-and-shoulders bottom fails to materialize.
- CHZ shaping a symmetrical triangle pattern on the 1-hour chart.
- IOMAP data has bulls staring at a wall of extraordinary resistance.
At the time of writing, CHZ is nearing the completion of a symmetrical triangle pattern on the intra-day chart, indicating that the digital token is primed to resume the decline.
Chiliz price needs time to bottom, forcing speculators to practice patience
Today’s Intotheblock In/Out of the Money Around Price data points to noteworthy resistance extending from $0.422 to $0.472 with 90.87% of the addresses out of the money and only 8.98% in the money.
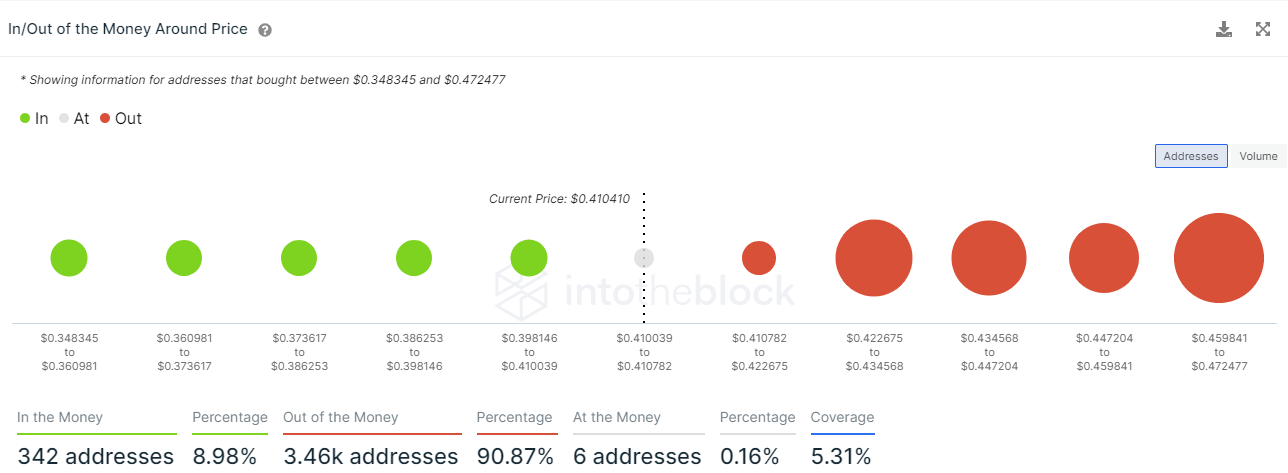
CHZ IOMAP data
Within the blink of an eye, CHZ fell 32% in overnight trading, smashing the 61.8% Fibonacci retracement of the February-March advance and putting it on pace to test the 100-day simple moving average (SMA) before a wave of buying moved through the cryptocurrency market.
A symmetrical triangle pattern quietly forms on the 1-hour chart with a measured move target of 26% from the triangle breakdown, equaling a price target of $0.297. Before reaching the target, CHZ will need to tackle the 61.8% retracement, which is just below the triangle’s breakdown at $0.392. Next up is the April 7 low at $0.365, followed by the overnight low at $0.313.
If selling accelerates, CHZ could hit the 100-day SMA at $0.260 and even the 78.6% retracement at $0.233.
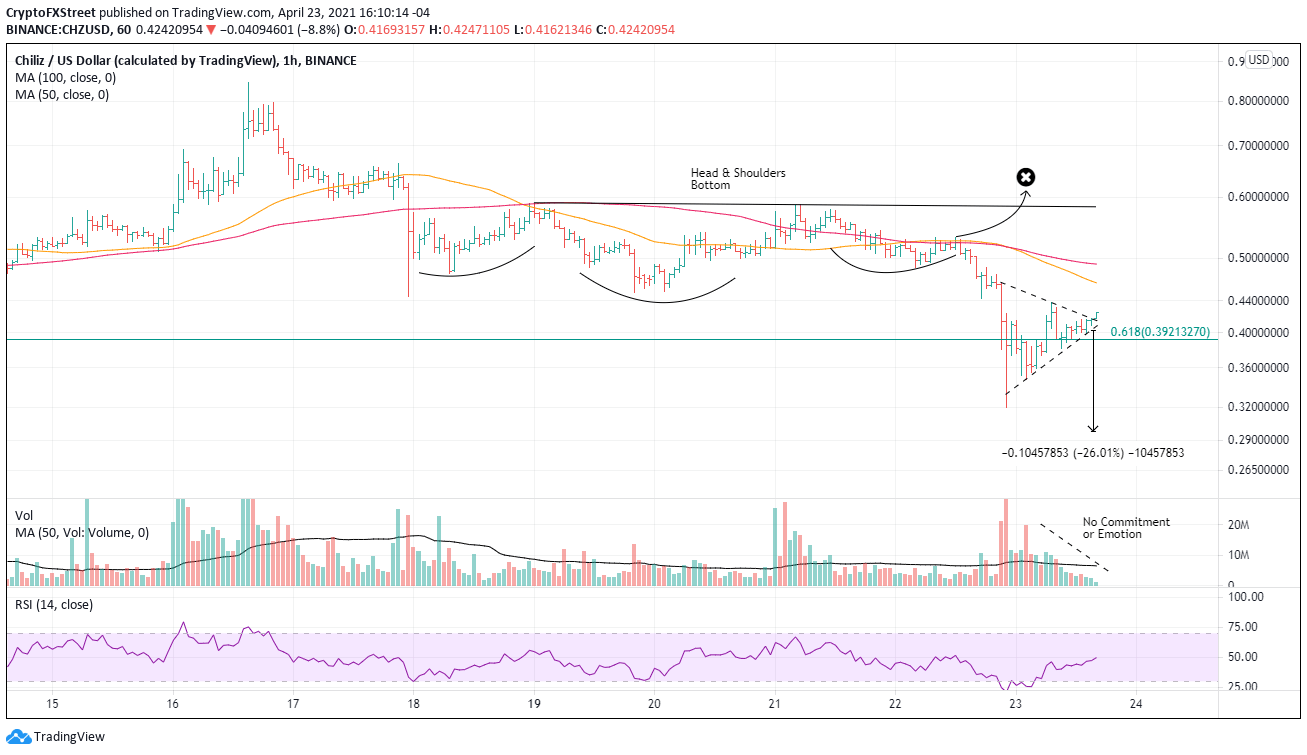
CHZ/USD 1-hour chart
The symmetrical triangle could resolve to the upside and gain price traction, putting it on a collision course with solid resistance between $0.441 and $0.451. If bulls successfully maintain the rebound, they can look forward to resistance at the 50-day SMA at $0.485.
