- Stellar price had a breakout from an ascending triangle pattern on the 4-hour chart.
- The digital asset seems to be facing really weak resistance ahead.
- A key indicator could be on the verge of presenting strong sell signals.
Stellar price has been trading inside an uptrend for the past week and had a significant breakout above a key pattern. The digital asset aims for new highs with very weak resistance ahead.
Stellar price on the way to $0.74
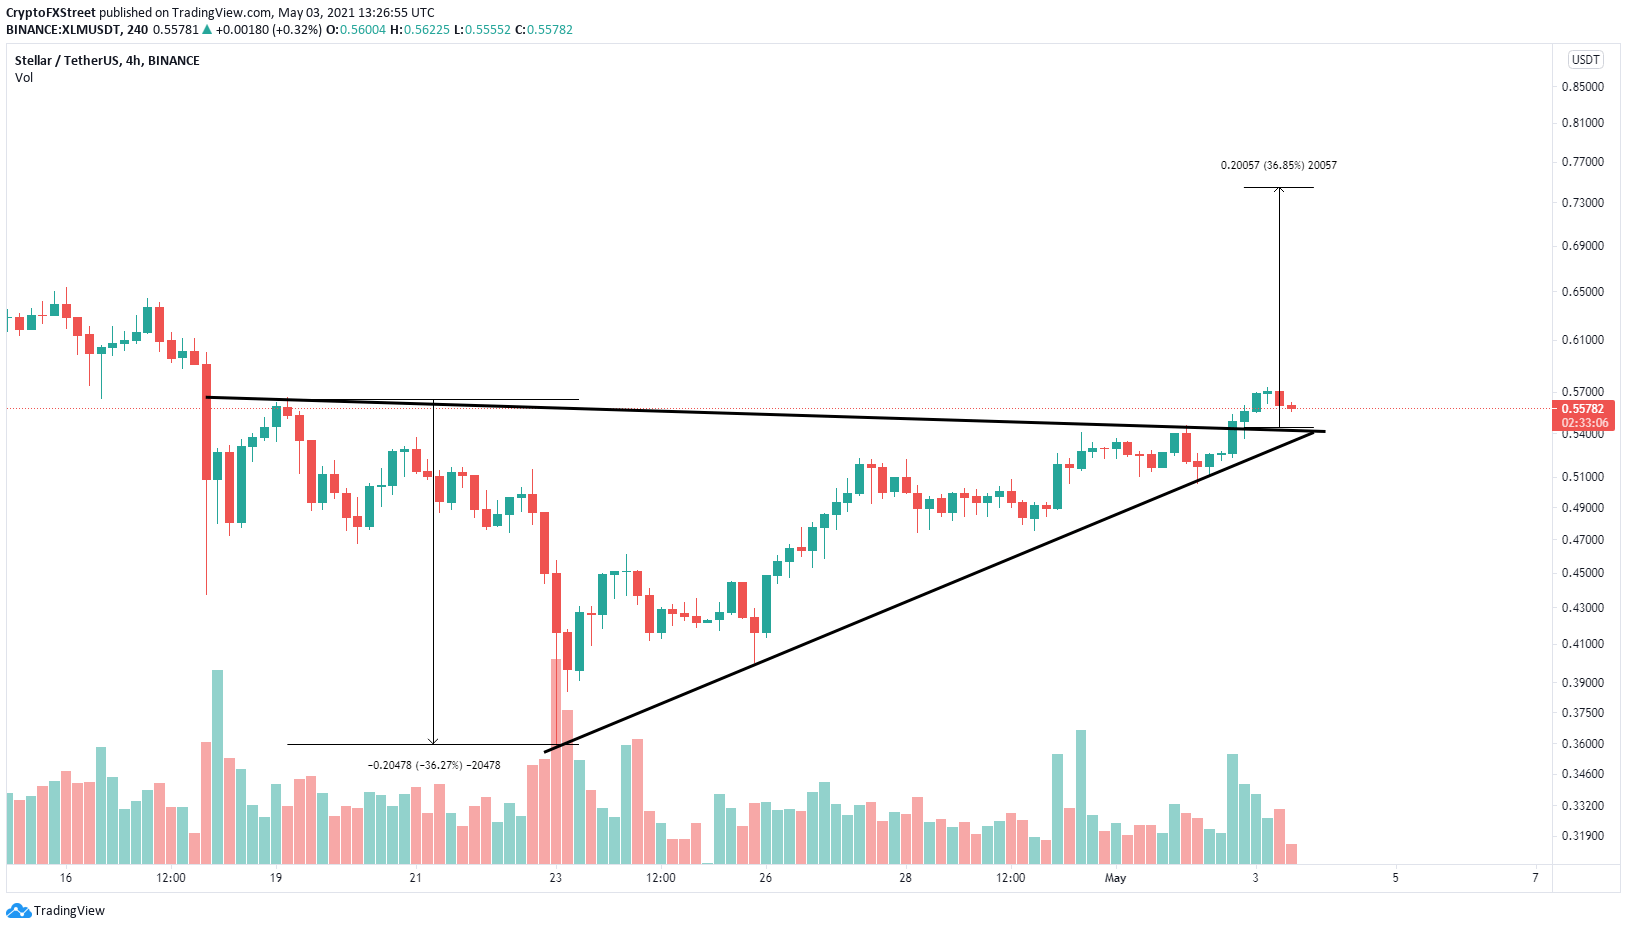
On the 4-hour chart, Stellar formed an ascending triangle pattern from which it had a breakout several hours ago. The price target is set at $0.74 and XLM seems to have basically no resistance ahead.
XLM/USD 4-hour chart
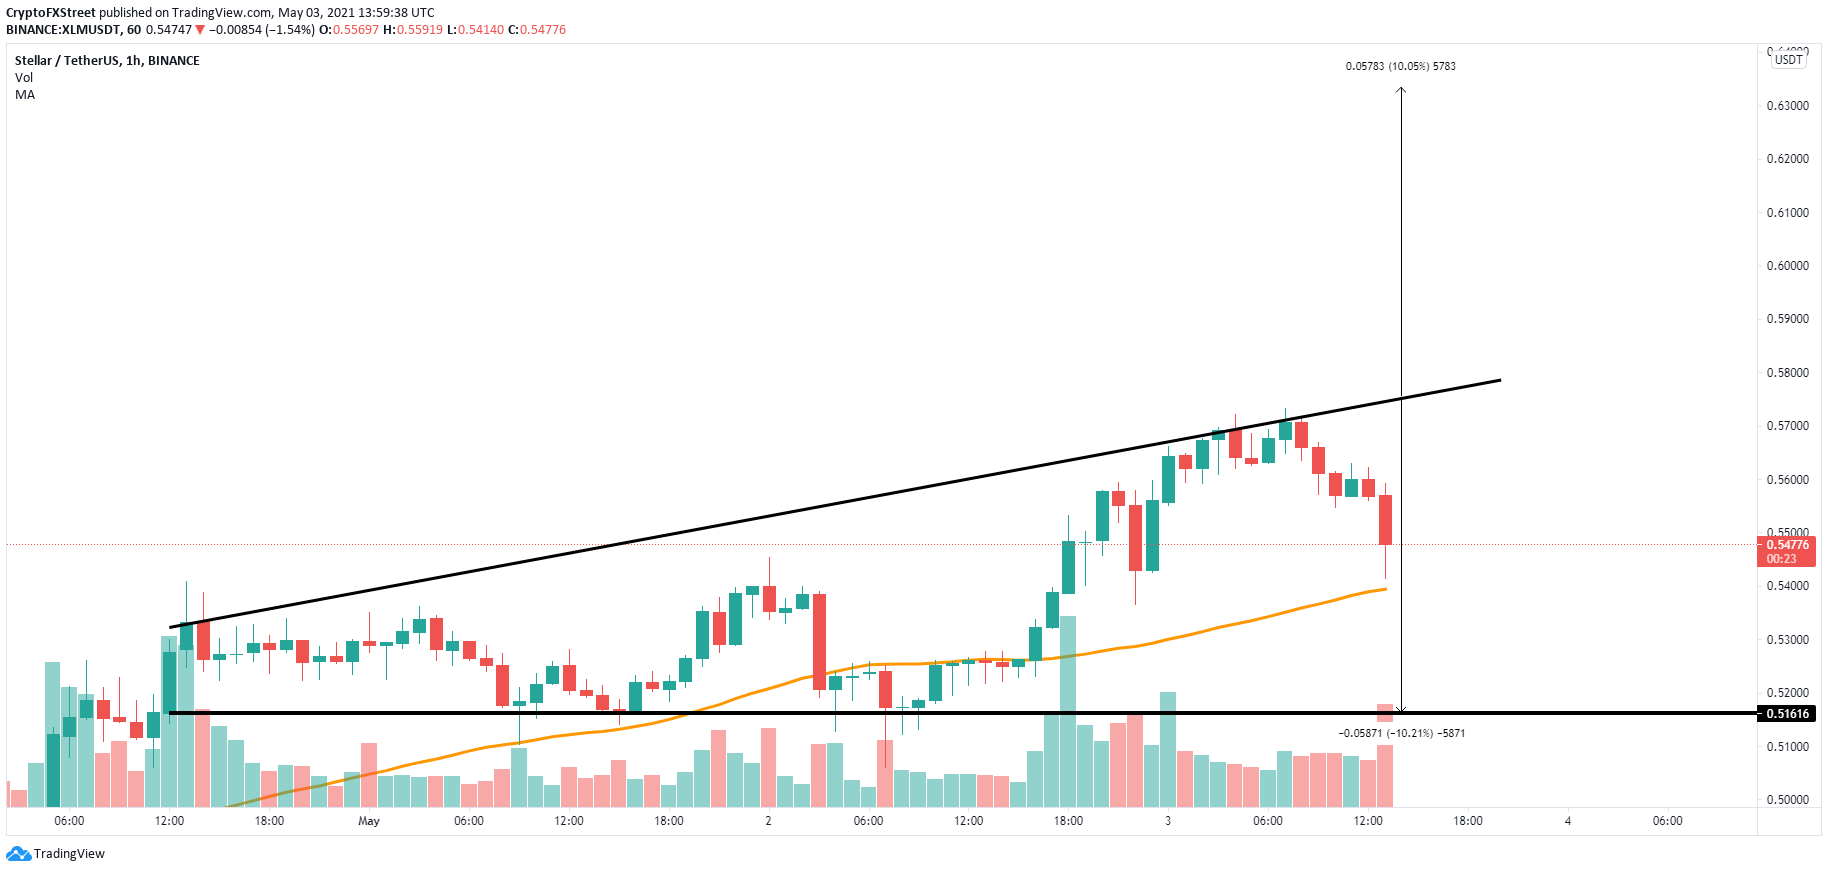
Additionally, on the 1-hour chart, Stellar also formed an ascending broadening wedge pattern and has bounced off the 50 SMA support level at $0.54. A breakout above the upper boundary at $0.576 can send the digital asset to a high of $0.633, adding credence to the overall bullish outlook.
XLM/USD 1-hour chart
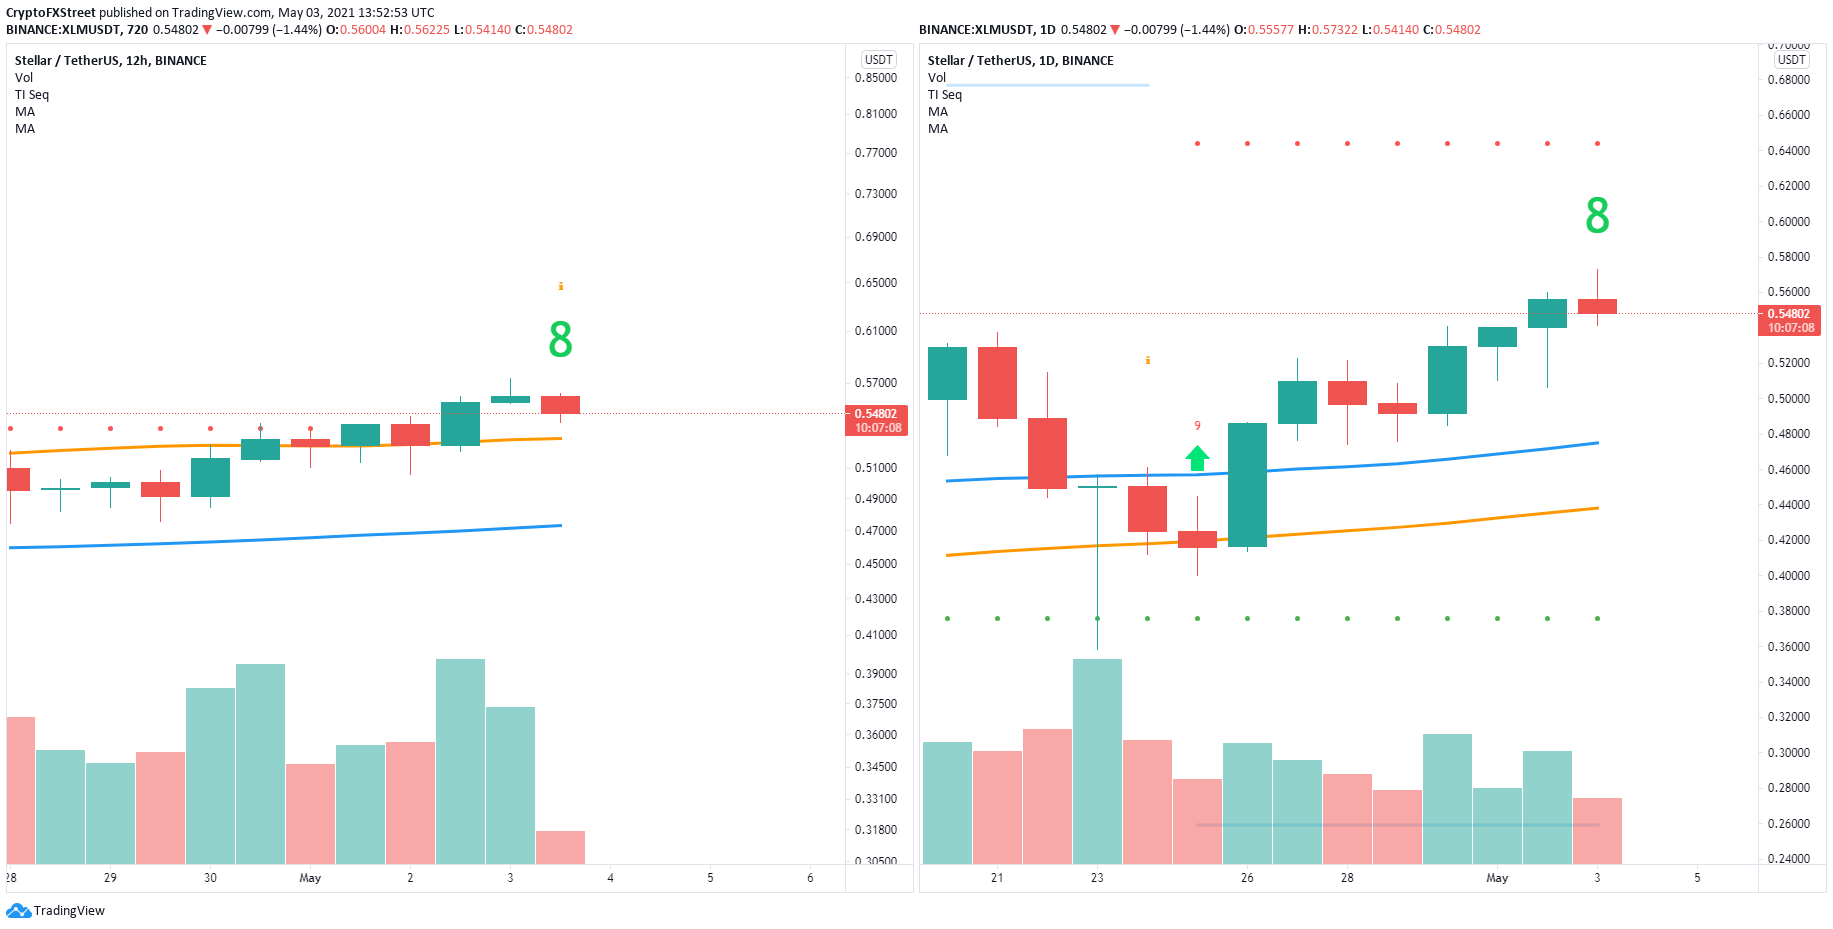
However, it is worth pointing out that the TD Sequential indicator has presented a green ‘8’ candlestick on the 12-hour chart and another one on the daily chart. These two candlesticks can transform into sell signals.
XLM Sell Signals
Confirmation of both signals can send Stellar price down to the 50 SMA at $0.53 on the 12-hour chart and even toward the 100 SMA at $0.475 on the daily chart.


