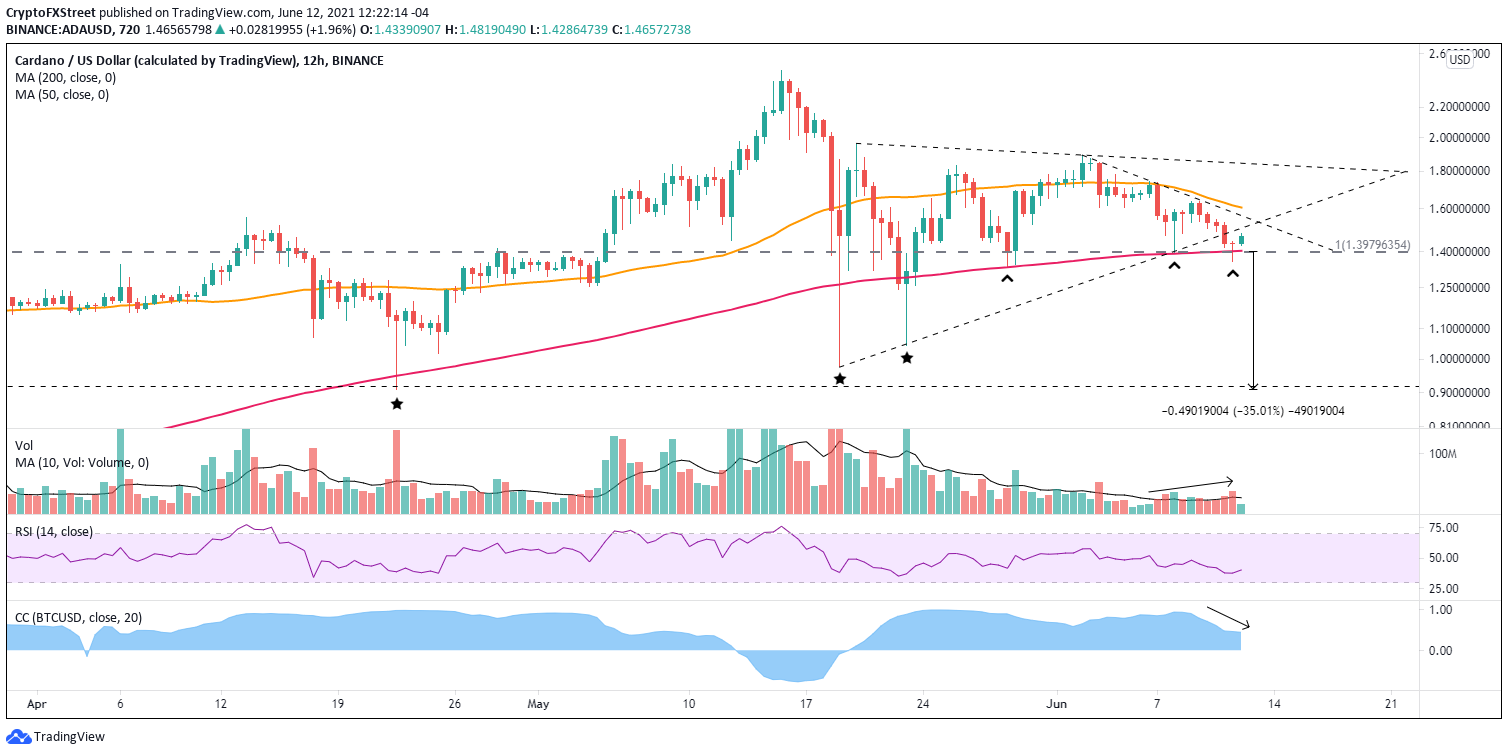
- Cardano price teeters on the edge of the critical $1.40 level as altcoins negatively decouple from Bitcoin.
- 200 twelve-hour simple moving average (SMA) offers explicit support but not price traction.
- Smoothed daily volume has begun to trend higher after trending lower throughout the symmetrical triangle formation.
Cardano price has fallen below the lower trend line of a symmetrical triangle that extends back to the May 19 low. It is a negative development and places the spotlight on the viability of the $1.40 support engineered by the 2018 high. The green token, like other altcoins, is positioned at a critical threshold that will have ramifications for weeks.
Cardano price inches closer to making a declaration of intentions
Today, ADA is the 5th largest cryptocurrency with a market capitalization of $46.73 billion. It is sandwiched between Binance Coin and Dogecoin. The decentralized, proof-of-stake (PoS) blockchain competes with Ethereum, and NBC recently categorized Cardano as the “most significant proof of stake cryptocurrency on the market.”
During the development of the ADA symmetrical triangle volume has declined, and the correlation to Bitcoin has remained tight. However, over the last few days, the volume has turned higher, and the close correlation with Bitcoin has tapered. Combining the metrics with the triangle’s resolution to the downside on June 11 proposes that Cardano price tendencies are becoming token-specific and may point to a convincing break of the omnipresent $1.40.
Supplementing the tendency towards the overthrow of Cardano price is the weight of a declining 50-day SMA at $1.60, the minor trend line from the June 3 high at $1.56 and the flattening 10-week SMA at $1.50.
A daily close below $1.39 is the initial warning that Cardano price has bearish intentions and may be seeking a decline to the May 19 low of $0.97. If the weakness leads to a daily close below the May 29 low of $1.33, investors should prepare for a sizeable decline in the days ahead.
Obvious targets are the May 23 low of $1.04 and the May 19 low of $0.97, but it is recommended that investors ready for a sweep below the April 22 low of $0.90, pronouncing a 35% decline from the imposing $1.40 level.
ADA/USD 12-hour chart
It will take a close above the 50 twelve-hour SMA at $1.60 to disqualify the cautious Cardano price outlook and reveal a tactical opportunity for investors to trade a rally to the triangle’s upper trend line at $1.84.
ADA is one of the compelling blockchain stories in the cryptocurrency market, and Cardano price has capitalized on it from late December 2020 to the May high. Still, like other higher profile altcoins such as MATIC, investors need to question if the story has been priced into the digital asset.
Technical indicators are tilted bearish, and Cardano price action is not instilling confidence. ADA needs to prove itself moving forward before investors allocate capital, whether to the short side and long side

