- Ripple trades at the apex of a symmetrical triangle as a 47% breakout looms.
- Closing the day above $0.9 is key to sustaining the ongoing uptrend.
Ripple is coming to the end of an extended consolidation period. The cross-border money transfer token failed to gain ground above $1 following the huge selloff in May. However, support at $0.8 continued to play a critical role, ensuring that bulls focus on recovery.
At the time of writing, XRP trades at $0.88 amid a generally up-trending cryptocurrency market. A recent break above the 50 Simple Moving Average (SMA) triggered buy orders as investors speculate a break above $0.9.
The Levels To Watch As Ripple Nurtures Uptrend To $1.34
The four-hour chart brings into light a symmetrical triangle. This chart pattern comes into the picture by converging a couple of trend lines, connecting a series of sequential peaks and troughs.
Generally, the trend lines meet at an approximately equal slope. However, as the pattern narrows to the right, a period of consolidation occurs. Note that the low trading volume precedes either a breakout or a breakdown.
It is worth mentioning that a breakdown occurs from the ascending trend line and identifies the beginning of a downtrend. Conversely, on the upside, a breakout happens at the upper trendline and signifies the start of a bullish trend – so those looking for upside crypto trading signals will be watching this closely.
Symmetrical patterns tend to have exact price targets for both breakouts and breakdown. These are measured from the highest point to the pattern’s lowest point. For instance, ripple will likely swing 47% higher to brush shoulders with $1.34.
Ripple price prediction: XRP/USD four-hour chart
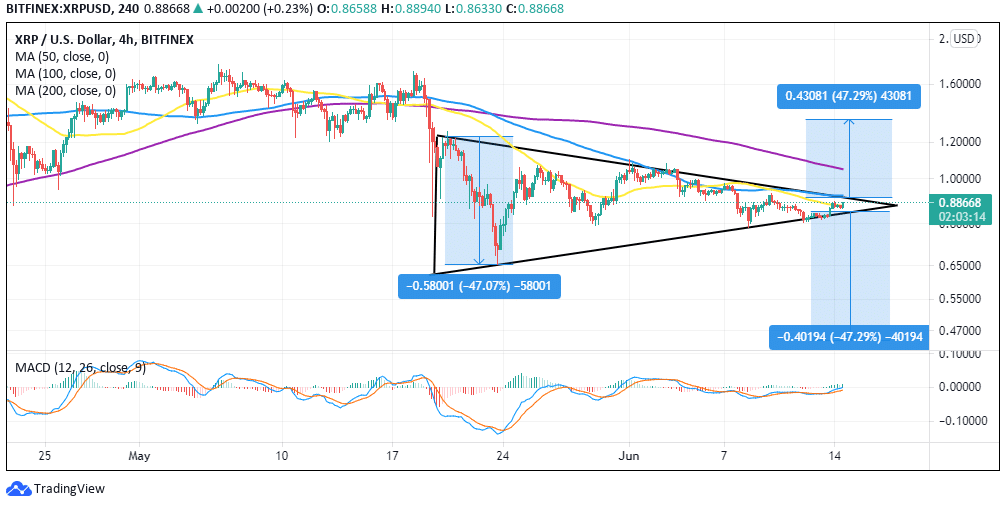
Subsequently, the impending uptrend has been validated by the Moving Average Convergence Divergence (MACD) indicator on the same four-hour chart. This is a momentum indicator tool following the trend of an asset. It also tracks the volatility of the asset, thereby identifying positions to buy the dip or sell the bottom.
According to ripple’s chart, the MACD has a vivid bullish outlook, as shown by the MACD line (blue) crossing above the signal line. Besides, as the technical indicator crosses into the positive region, more buyers are encouraged to speculate on the price swinging higher.
What Could Invalidate Ripple’s Bid For $1.34
The uptrend will be sabotaged if ripple fails to close the day above $0.9. Such a move is bound to leave buyers frustrated, allowing sellers to come in and increase their entries. In addition, an increase in overhead pressure will jeopardize support areas at $0.85 and $0.8, respectively, and perhaps allow the bearish leg to extend to $0.65.
Get Free Crypto Signals – 82% Win Rate!
3 Free Crypto Signals Every Week – Full Technical Analysis