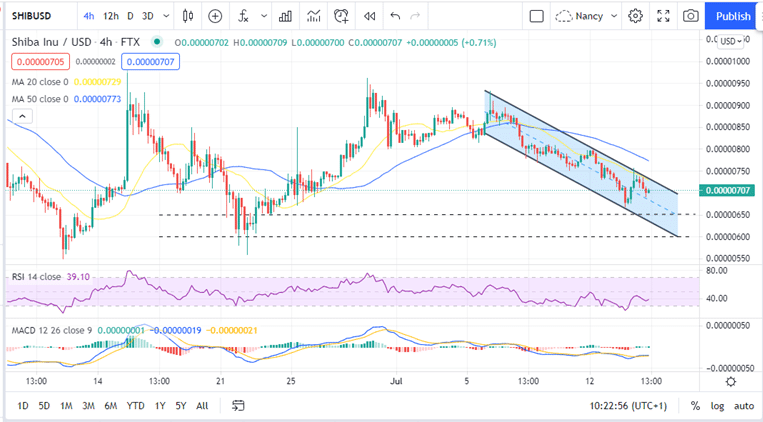
- Shiba Inu price stuck between the 20-day SMA and the midline of the descending parallel channel.
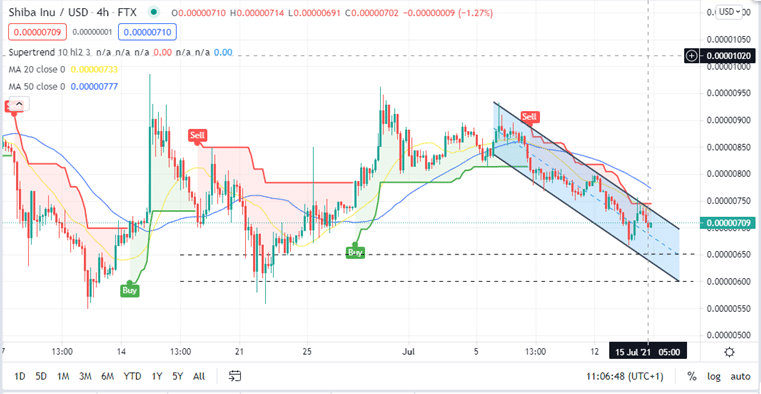
- The SuperTrend line remains above the price adding credence to the bearish outlook.
Shiba Inu price continued the downtrend to close the day on Wednesday $0.00000723. This is a 22% decline from the a two-week high of $0.0000093 recorded on July 5. Overhead pressure reinforced by the upper boundary of the descending parallel channel and the 20-day Simple Moving Average (SMA) might drive the SHIB price even lower towards the $0.0000060 mark.
Shiba Inu Price Locked Between the Channel’s Midline and the 20-day SMA
Since July 11, the SHIB price has been spiralling diagonally between the descending parallel channel’s midline support and the 20-day SMA resistance. At the time of writing, SHIB was exchanging hands at $0.00000707 while bulls battle to overcome the 20-day SMA barrier. Failure to remain above this zone will frustrate the bull’s efforts while enhancing the bears’ firm grip on the meme coin.
If this happens, the Shiba Inu price will continue its downswing slicing through the mid-line of the descending parallel channel as shown on the four-hour chart. This will force SHIB to re-test an important support at $0.0000070 and $0.0000065 respectively. More overhead pressure will see the Shiba Inu anchor on the support provided by the lower trendline of the channel at $0.0000060.
-If you are interested in learning how to buy cryptocurrency then have a read of our guide to getting started
SHIBA INU Price (SHIB/USD) Four-Hour Chart
The SuperTrend indicator on the four-hour chart validates the pressure the bears have out in to push the Shiba Inu price downwards. The SuperTrend is a chart overlay indicator tracks an asset’s trend. It uses a true average to show the price volatility. The SuperTrend indicator flashed a sell signal on July 07. This was confirmed by a death cross that occurred on July 09 when the 20-day SMA crossed below the 50-day SMA.
Since then, the Shiba Inu price has been on the decline. Note that as long as the SuperTrend line continues to hold above the price, Shiba Inu bears could achieve their target of pushing the price towards $0.0000060.
The SuperTrend Indicator Confirms the Bearish outlook
A look on the Other Side
On the upside, there are two positive crypto signals for the Shiba Inu bulls. Firstly, the Relative Strength Index indicator upward rise shows a strong bullish momentum at the moment. Moreover, the Moving Average Convergence Divergence (MACD) indicator accentuates this bullish outlook as the MACD line (blue) remains above the signal line (orange). This bullish momentum will be sustained once the MACD moves upwards towards the midline and eventually into the positive region.
Looking to buy or trade Shiba Inu now? Invest at eToro!
Capital at risk
