- Stellar price must overcome the 50-day SMA barrier to validate the rise to $0.25
- A three inside-up candlestick recently presented a bullish signal suggesting XLM is recovering.
Stellar price has been on a downward spiral from a two-week high at $0.29. A technical look at the four-hour chart reveals that XLM is forming a V-shaped recovery in the near term. This after numerous attempts to recover failed as the Stellar price continued to trade below the 50-day Simple Moving Average (SMA). As such, the recent drop to areas around $0.22 saw the bulls flex their muscles in an attempt to push the price upwards.
Can Stellar Bulls Sustain the Recovery to $0.25?
Stellar price has experienced has experienced a quick rebound after re-testing the support level at $0.22, recovering by more than 7% in the past 24 hours. A V-shaped recovery occurs when an asset experiences a massive price decline and then makes a sustained uptrend.
At the time of writing, XLM was trading at $0.23 as bulls aim to push the highs beyond $.25. If this pattern continues, it is expected that the Stellar price will quickly jump to reach a significant resistance at $0.27.
Stellar Price (XLM/USD) Four-Hour Chart
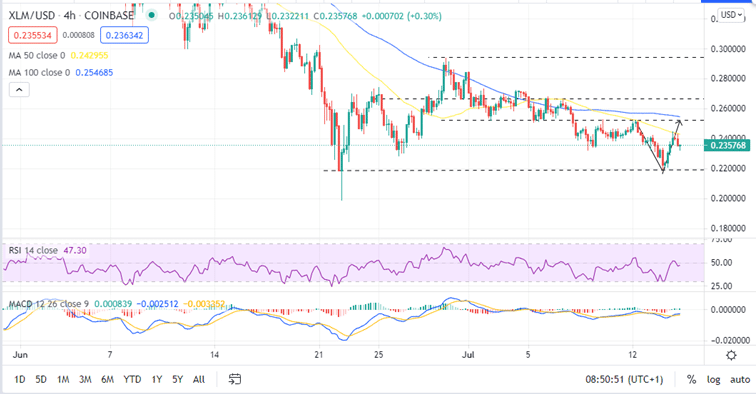
The three inside up candlestick has flashed a bullish recovery on the same four-hour chart. This bullish reversal patter occurred at the bottom of the V-shape and hits at XLM bears losing momentum to give way for the more aggressive bulls. Note that most of the previous bullish crypto signals from the same candlestick pattern were confirmed in the previous attempts to recover. This indicates that Stellar price may remain bullish as buyers target areas beyond %0.25.
The MACD Indicator Shows Stellar is Bullish
From a more technical viewpoint, the Moving Average Convergence Divergence (MACD) indicator validates the bullish outlook. This is shown by the continued movement of the MACD line above the signal line. This bullish signal will continue to ripen once the MACD crosses above the zero line into the positive region.
At the moment, buyers should focus on slicing through the 50-day SMA around $0.24. If this happens, the bulls will be bolstered to push towards $0.25 and perhaps make a go at $0.3.
- Are you looking for the best crypto cryptocurrency to buy? Check out our detailed guide.
On the flip side, the 50-day SMA is acting as a temporary resistance and failure to close the four-hour candlestick above this area may result in another downswing. Moreover, the appearance of a red candlestick at the end of the chart shows that bears may be taking over. If this happens, the support at $0.22 may not be strong enough to absorb the overhead pressure. A move further down would see the Stellar price test the psychological support at $0.2 and the June 22 low at $0.19.
Looking to buy or trade Stellar now? Invest at eToro!
Capital at risk
