- Ethereum price enters the sell zone after $2,400 is rejected by the upper boundary of an ascending parallel channel.
- ETH sends multiple sell signals on the four-hour chart.
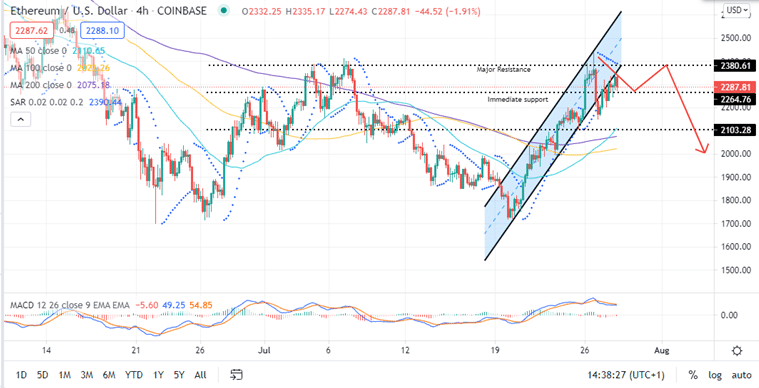
On Tuesday, Ethereum recoiled from the weekly high of around $2,440 and closed the day just outside the price range defined by the ascending parallel channel. The resistance at $2,380 rejected the Ethereum price that had broken the $2,400 barrier. At press time, ETH hovers around $2,287 as bears take control of the market.
Ethereum Price Could Slump to the $2,000 Psychological Level
The smart contracts token trades outside the ascending parallel channel price range. The upper edge of the pattern was vital in making sure that gains do not stay above the $2,400 psychological level as the journey back to $2,000 seem to have started.
In addition the lower boundary acts coincides with the immediate resistance at $2,380 limiting upward price action. A daily closure below this level and by extension below the Immediate support around $2,264 will trigger sell orders as the bears target Ethereum price at $2,200.
The pull back to $2,000 could however be delayed by the 50-day Simple Moving Average (SMA) that coincides with a major support level around $2,100. The 100-day and 200-day SMAs may also absorb any bearish pressure seeking to lower ETH price lower.
Note that Ethereum price has flashed multiple bearish signals on the four-hour chart indicating that a downswing is inevitable. To start with, the Moving Average Convergence Divergence (MACD) indicator has a vivid bearish outlook. This is due to the position of the 12-day Exponential Moving Average (EMA) below the 26-day EMA.
The Parabolic SAR is still negative adding to the bearish narrative.
Ethereum Price (ETH/USD) Four-Hour Chart
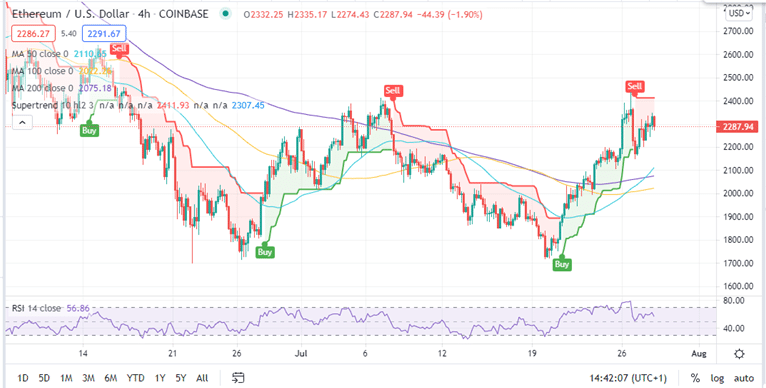
At the same time, the SuperTrend indicator on the same four-hour chart has recently triggered sellers to collect their profits by presenting a sell crypto signal. The SuperTrend indicator overlays the chart following Ethereum’s trend like moving averages. It uses average true range (ATR) to send either short or long signals.
Yesterday it sent the call to short ETH, which is still in the sell zone as bears focus on $2,200.
Furthermore, the Relative Strength Indicator (RSI) adds credence to this bearish narrative by its sharp dive towards the midline, currently at 55.81.
ETH/USD Four-Hour Chart
A look Over the Other Side
Note that if the appearance of a golden cross late yesterday on the four-hour chart is accentuated by the movement of the MACD above the signal line in the near term, the bearish narrative could be invalidated.
For this to hold, Ethereum price must close the day above the $2,380 resistance level. If this happens, the bullish leg that has been seen over the last one week could be extended towards the June 15 high around $2630.
- This list of top crypto exchanges can help you to buy Ethereum.
Looking to buy or trade crypto now? Invest at eToro!
Capital at risk
