- Tron price is hovering horizontally above the 50 SMA.
- Squeezing Bollinger Bands point to market indecision
- TRX upward movement hindered by powerful resistance at $0.0658
Tron price has been uneventful since Aug 01 as it trades sideways amid market indecision. Before this, TRON had rallied 28% from $0.0503 on July 21 to $0.064 on July 31. During this rally, TRX managed to flipped the 50, 100 and 200 Simple Moving Averages (SMA) from support to resistance. Since then, the asset has been in a horizontal price action around $0.064 after being rejected repeatedly by the $0.0658 major resistance level.
Tron Stuck between the 50-day SMA and Middle Boundary of the Bollinger Band
Tron price volatility has been decreasing since Aug 01. This is validated as the squeezing of the Bollinger Bands (BB) towards each other, indicating market indecision. Since then, the TRX has been hovering between the 50-day SMA support wall and the BB middle boundary.
Meanwhile, TRX is currently changing hands around $0.0642 on most crypto exchanges as bulls struggle to hold above the 50-SMA. Note that the closure of the four-hour candlestick above this zone will affirm the bullish grip as gains stretch towards the BB upper boundary.
If this happens, TRX will try to overcome the powerful resistance at $0.0658. However, any further movement upwards might be delayed by the resistance around the $0.0686 zone. It is important to note that the narrowing of the Bollinger Bands is an indication of market consolidation. This means that any pressure from the bulls might be met by equal bearish pressure forcing TRX to remain below BB middle boundary at around $0.065.
- Join one of crypto signals telegram groups to stay informed of the market momentum.
Tron Price Four-Hour Chart
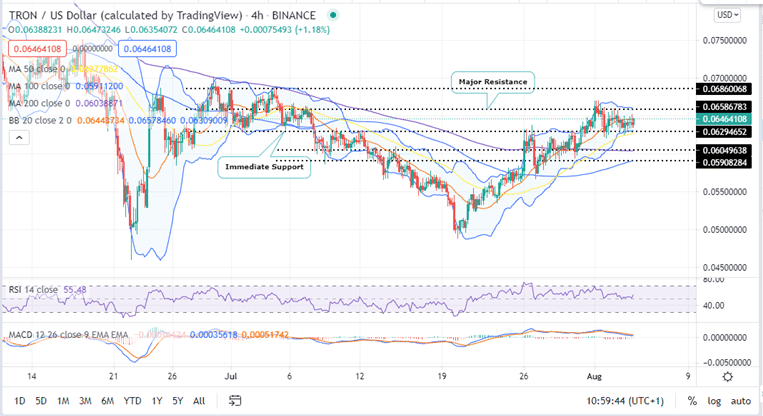
The horizontal movement of the Tron price is accentuated by the horizontal movement of the (Moving Average Convergence Divergence (MACD) indicator close to the midline. Moreover, the position of the Relative Strength Index (RSI) indicator close to the midline at 55.48 also shows that the pressure from bulls and bears cancels out.
Which Way TRON?
If TRX overcomes the $0.0658 major resistance level, the upside potential could come into play in the longer term with the $0.070 and the %0.0750 psychological levels in the offing.
On the downside, if Tron price falls below the 50-day SMA at $0.0692, it could trigger selling orders that could push Ripple down to re-test the 200-SMA at $0.0604 and the 100-SMA at $0.0590 support levels respectively.
Note that the position of the MACD below the signal line adds credence to this bearish outlook.
- Do you wish to trade in crypto? Our beginners’ guide on how to buy cryptocurrency might be useful.
Looking to buy or trade Tron now? Invest at eToro!
Capital at risk
