- Chainlink price trades horizontally as the market consolidates
- RSI and MACD indicators affirm the consolidation of the Chainlink market.
- LINK price breakout below $24 will confirm the fall towards $19.
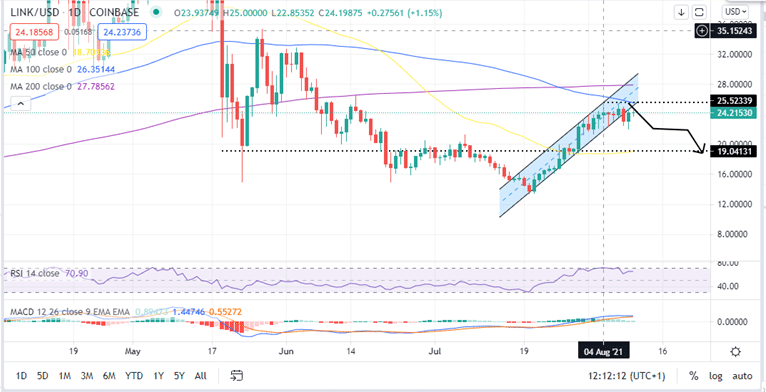
The Chainlink price is trading below the lower boundary of an ascending parallel channel. A daily closure below the 100-day Simple Moving Average (SMA) at $25.52 will trigger sell orders that could see LINK tank to $19.
Chainlink Price In A Horizontal Price Action
For the past four days, Chainlink has been hovering between the $25 resistance level and the $22.98 support wall. After failing to hold above the $24 psychological level over the weekend recovery began on Monday that saw LINK rise by over 7% to highs of around $24.90. However, this daily rally was not enough to push the Chainlink price higher as bears entered the scene to counter the bullish pressure.
At the time of writing, LINK was trading at $24.21 amidst market indecision. A doji candlestick appear to have formed on the daily chart. This candlestick pattern is used in technical analysis to show that the market is consolidating and a significant move may occur in any direction.
The horizontal movement of the Chainlink price is accentuated by the horizontal movement of the (Moving Average Convergence Divergence (MACD) indicator. Moreover, the sideways movement of the Relative Strength Index (RSI) indicator also shows that the pressure from bulls and bears is cancelling out.
- Do you want to trade crypto? Read our guide on best cryptocurrency to buy
LINK/USD Daily Chart
Although the doji candlestick pattern does not have a defined bullish or bearish breakout, other on-chain metrics indicate that LINK’s move upwards faces stiff hurdles at around the $28 psychological level. According to IntoTheBlock’s IOMAP model, this zone sits within the $26.98 and $31.67 price range where 51 million LINK were previously bought by 73,000 addresses.
Chainlink IOMAP
Which Way LINK?
If LINK overcomes the 100-day SMA at the $25 major resistance level, the upside potential could come into play in the longer term with the 200-day SMA at $28 and the May 27 high at around $34.5 in the offing.
Note that the position of the MACD above the signal line in the positive region adds credence to this bullish outlook.
On the downside, if the Chainlink price closes the day below the $24 psychological level, it could trigger selling orders that could push LINK down to re-test the 50-day SMA at $19 and the July 20 low at $13.3 respectively.
- Do you wish to trade in crypto? Our beginners’ guide on how to buy cryptocurrency might be useful.
Looking to buy or trade LINK now? Invest at eToro!
Capital at risk


