- Bitcoin Cash Price loses crucial support at the 200-day SMA.
- Multiple techinical indicators and signals point to a bearish BCH.
- Bitcoin cash must reclaim the support above $650 to resume the uptrend.
Bitcoin Cash has rallied 86% from the July low at $384 to the August 16 high above $715. However, seller congestion at the $690 major resistance level has seen BCH undo these gains over the last couple of days. The correction has seen the Bitcoin Cash price lose cricial support at $650 to tank below 200-day Simple Moving Average (SMA).
Bitcoin Cash Price May Tank to $550
Bitcoin cash price prediction has turned bearish as sellers are focused on pushing BCH towards the $550 support wall.
At the time of writing, Bitcoin Cash is trading in the red at $637 as bears focus trading below the $620 support wall which is braced by the 100-day SMA to pave the way for slumping to $550.
Note that several technical indicators and signals affirm BCH’s bearish outlook as seen on the daily chart.
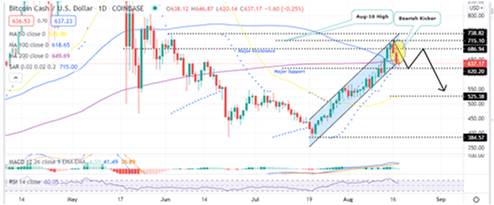
First, the appearance of bearish kicker candlestick pattern indicates that bears are in control of the Bitcoin Cash price.
Secondly, note that the two bearish kicker candlesticks have pushed BCH/USD price outside the rising channel price range. When this happens, it is usually a bearish sign as the bullish momentum that kept the price within the rising channel has faded. This means bears are not in control.
Thirdly, losing the support at the 200-day SMA adds credence to the bearish outlook.
Fourth, the downward movement of the MACD line shows that Bitcoin Cash bullish momentum is weakening. Note, the bullish narrative will be validated once the MACD line falls below the signal line. This will send a sell crypto signal which could happen in the near term.
BCH/USD Daily Chart
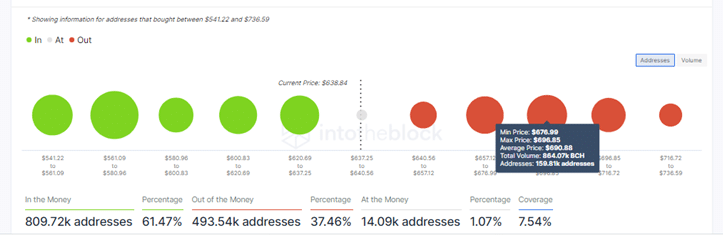
In addition, the In/Out of the Money Around Price (IOMAP) metricks by IntoTheBlock accentuate this bullish outlook. The model shows that BCH faces significance resistance around the $690 major resistance zone. It is found within the $679 and $696 investors cluster where approximately 864,000 BCH were previosuly bought by roughly 159,000 addresses.
BCH Could Reach These Levels
Realise that a daily closure for the Bitcoin Cash price above the 200-day SMA at $650 will renew the bull’s strength to continue the uptrend. However, a bullish breakout will be confirmed once BCH trades inside the rising channel again and rises above the August 16 high at $715. If the is happens, Bitcoin Cash could explore areas around the May 27 high above the $800 psychological zone.
On the flipside, if BCH losses the current major support at the 100 SMA and closes the day below $620, this could bring the $550 support wall into play. A further fall in the BCH price could see bulls seek retreat further to seek support at the 50 SMA at 525.
Looking to buy or trade Bitcoin Cash now? Invest at eToro!
Capital at risk
