- Chainlink price overcomes 200-day simple moving average (SMA) after climbing 110% between July 21 and August 15.
- Breaking the ascending channel trend line will bolster the DeFi coin bulls to record higher highs.
- Chainlink price feeds went live on the Fantom Opera mainnet increasing investors’ appetite for LINK.
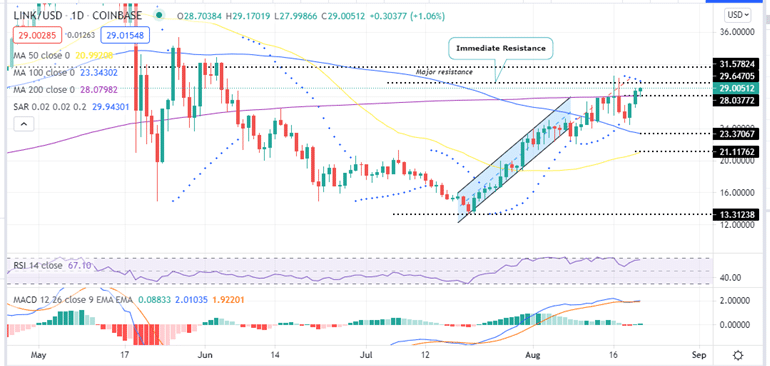
After having rallying 110% from a low of $13.31 on July 20 to close the week at $28.03 on Sunday August 15, the Chainlink price action was marked by indecision at the beginning characterised by the Monday doji stick. This was due to heavy resistance at the 200-day Simple Moving Average. The LINK price traded at or below the 200-day SMA for seven consecutive days before finally bursting the resistance on Friday.
Based on bullish technical indicators and the break of the stifling resistance, the odds of LINK confronting new realities are increased.
Chainlink Price, The Week That Was
LINK/USD price rose by approximately 5% over the last 7 days. Significantly lower than the 22% from the previous week, Chainlink closed Sunday August 15 at $28.03 as the bulls focused on undoing Saturday’s losses.
Chainlink price started the week trading in green amidst market indecision as bulls and bears cancelled out, but recorded an intraweek high of $30.53 on Monday. Rejection from the $29.64 major resistance level saw LINK retreat to the 200-day SMA at $28.03, as things turned bearish on Tuesday.
LINK traded has two straight bearish sessions between Tuesday and Wednesday but found formidable support at the $24 psychological level. This bolstered bulls who strived to push the Chainlink price from an intraweek low of $24.33 on Thursday to close the day around $27.13.
This bullish momentum was sustained on Friday which saw the asset overcome the stubborn resistance at $28.03 embraced by the 200-day SMA to get close the day at $28.99. At the time of writing, LINK is dancing at $29.00.
- Read this guide if you want to know the best cryptocurrency to buy.
During this week LINK overcame recovered from two straight bullish days and flipped the 200-day SMA from resistance to support. This has been the week’s upside.
LINK/USD Daily Chart

LINK Price, The Week Ahead
Chainlink price forecast for the week ahead remains bullish as its expected to confront new realities upwards.
Note if LINK closes the week on Sunday above the lower trendline of the rising channel, the DeFi coin could jump to around the $36.00 mark after which a push to the May 19 high around $44.00 would be the next logical move. This would represent almost a 50% gain from the current price.
Note that closing the week below the 200-day SMA at $28.03, LINK price would slip below the $25 mark and revisit the 100-and 50-day SMAs at $23.37 and $21.17 respectively.
Why is Chainlink bullish?
A part from the positive parabolic SAR and the upward movement and entry of the RSI into the overbought zone on the daily chart, the position of the MACD above the zero line accentuates the bullish bias. Also note that the MACD sent a buy signal Friday on the same timeframe. This happened when the 12-day EMA (blue line) crossed above the 26-day SMA (orange line).
In addition, there have been positive news regarding the Chainlink blockchain network. On August 18, Chainlink price feeds went live on the Fantom Opera mainnet, a scalable platform hosting Decentralised Finance applications (DeFi apps) and enterprise software. Cryptocurrency valued at approximately $380 million has been staked in Fantom. This new integration enables Chainlink developers to access real-time price data on cryptocurrencies and perform tasks such as settling futures and options contracts.
Chainlink is an oracle token designed for integrating real-world API into smart contracts execution.
Where To Buy LINK?
If you wish to buy cryptocurrencies including Chainlink, exchanges such as eToro , Binance, Coinbase, Bittrex and Kraken are good places to visit.
Looking to buy or trade Chainlink now? Invest at eToro!
Capital at risk
