- Aave price loses 2.43% over the last 24 hours to find support at the $350 mark.
- AAVE’s upward movement hindered by the 200-day SMA.
- The short-term price prediction for Aave is bearish as accentuated by technical indicators.
The Aave price had an impressive 110% rally from the July 20 low around $212.70 to reach a three-month high above $447 on August 16. Seller congestion at the $450 psychological level pushed AAVE towards the $400 level. Aave closed the week on Sunday August 22 at $401.56.
Aave opened the week on Monday August 23 trading in the green with bulls pushing the price to reach in an intraweek high at $415.18 on Tuesday August 24. On Wednesday, the bulls tried to pull AAVE/USD towards the $400 mark with little luck. Thursday’s bearish session saw the digital asset tank below the 200-day Simple Moving Average (SMA) to reach an intra-week low at $341.69. On Friday, the bulls pushed AAVE up to close the day above the 200 SMA at $372.20.
AAVE traded in the red over the week to close the week on Sunday at around the $366 mark embraced by the 200-day SMA.
Aave Price Buying Appetite To Increase When More Fundamentals Kick In
At the moment, AAVE investors do not have any significant fundamentals specific to Aave that could help boost the price in the near term. The news of rebranding from AAVE Pro to AAVE Arc may have worked for the 30% rally between August 05 and 06 when the news came out. But it appears the associated bullish momentum has faded away.
It is expected that the rebranding of AAVE’s name from Aave Pro to Aave Arc will allow institutional traders to invest in the DeFi space. AAVE Arc provides private pools for users to enjoy direct exposure to digital assets, giving them access to Defi yields even as they experience the benefits of transparency and automation.
These positive news supported the AAVE/USD price, pushing higher to the three-month high above $447.
It is expected that the bullish momentum will pick up again after the launch of the decentralized social networks on the Aave platform that is expected to take place in the near future. This is expected to take on the likes of Twitter, Instagram and Facebook as it will let uses to earn rewards as they interact and post on it.
AAVE is exchanging hands at $351.90 on most crypto trading platforms.
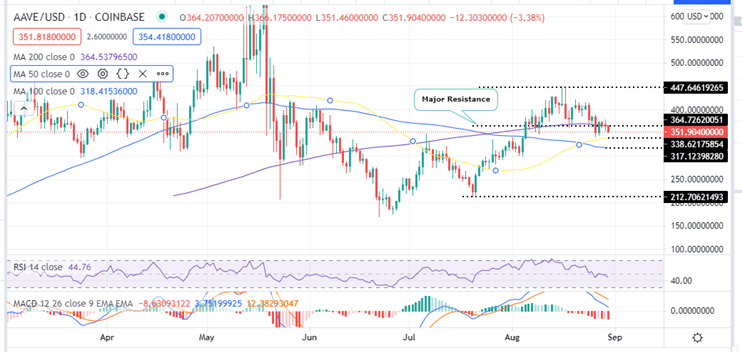
Aave Price Upward Movement Hindered By The 200 SMA
Since August 26, AAVE has been closing the day below the 200-day SMA that is currently at the $366 mark. Today, Aave is trading in the red for the third day running with a continuous rejection from the 200-day SMA.
Note that if AAVE fails to overcome this major hurdle, it might close the day below the $350 psychological level. If thus happens, Aave price the next key level to watch would be the 50-day SMA at $338.62 followed by the 100-day SMA at $317.12.
This bearish narrative for the AAVE/USD price is validated by the down-sloping SMAs. Moreover, the nose-diving Relative Strength Index (RSI) away from the midline (currently at 45.61) is an indication that bears are in control of the Aave price.
Moreover, the downward movement of the Moving Average Convergence Divergence (MACD) Indicator shows that the bears are more powerful at the moment. Note the bearish leg will gain more momentum once the MACD crosses the zero line into the negative zone. Also, as long as the MACD line (blue) continues to move below the signal line (orange), the bearish leg is set to continue.
AAVE/USD Daily Chart
Apart from the technical indicators, the In/Out of the Money Around Price (IOMAP) on-chain metrics indicate that the AAVE/USD price faces significant resistance upwards. The immediate resistance at $366 embraced by the 200-day SMA is within the $366 and $376 price range where approximately 6,750 addresses previously bought 514,990 AAVE. Any attempts to push the Aave price above this point could trigger sell orders from traders who want to break even curtailing any bullish efforts.
Aave IOMAP Chart
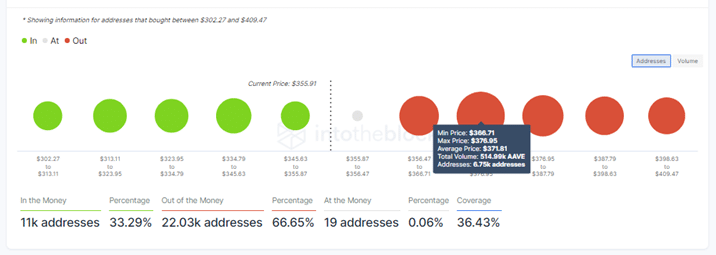
On the other hand, the immediate support provided by the $350 psychological level is relatively weak. It is within the $345 and $355 price range where only 1,520 addresses previously bought 286,420 AAVE. This support is not robust enough to absorb any ensuing selling pressure, pointing to a bearish Aave in the near term.
Note that, Aave’s bearish thesis could be invalidated if it closes the day above the 200-day SMA at $366. If this happens, the bullish leg could be restarted that could see AAVE rally to the recent three-month high $447.46. Any move beyond could see AAVE rally towards the $500 psychological level representing a 42% rally from the current price.
Where To Buy AAVE Now?
The top exchanges for trading in Aave currently are: eToro, FTX, Binance and Coinbase. You can find others listed on our crypto exchanges page.
Looking to buy or trade Aave now? Invest at eToro!
Capital at risk
