- Solana Price has dropped 9.47% over the last 24 hours to trade at $130.
- SOL remains bearish as it trades within the confines of a descending parallel channel.
- Solana price prediction is bearish as it aims for a 23% drop to areas around $100.
Solana price is trading at $130.44 with a bullish bias. The SOL price is down 9.47% over the last 24 hours with a daily trading volume of $4,752,453,458 which has also dropped by 9.83% over the same time frame.
SOL has traded in three straight bearish sessions between Sunday and Tuesday. This bearish run saw the ‘Ethereum killer’ lose as much as 33% from Sunday’s high around $172.87 to Tuesday’s low below $115. Solana is currently trading in the green as bulls strive to avoid any further losses.
Solana Price Chart Pattern Aims For $100
The Solana price has formed a descending parallel channel chart pattern on the four-hour chart after setting a new all-time high (ATH) around %216.09 on September 09. Although the bulls tried to push the Solana price above the $200 psychological level on September 10, they could not hold the higher levels.
SOL’s has dropped 47% from the ATH above $216 embraced by the upper boundary of the descending channel on September 09 to a low of $115 on September 21.
Note that as long as the Solana price remains within the confines of the descending channel, it will continue to record lower lows. At the time of writing, SOL/USD price is bullish at $130.44 and is sitting on immediate support around the$128 mark. Note that a daily closure below this level will see SOL drop lower to tag the $0120 mark. A clear bearish breakout will be achieved once Solana price breaks below this level to tag the tip of the lower boundary of the descending parallel channel at $100. This represents a 23% move downwards from the current price.
SOL/USD Four-Hour Chart
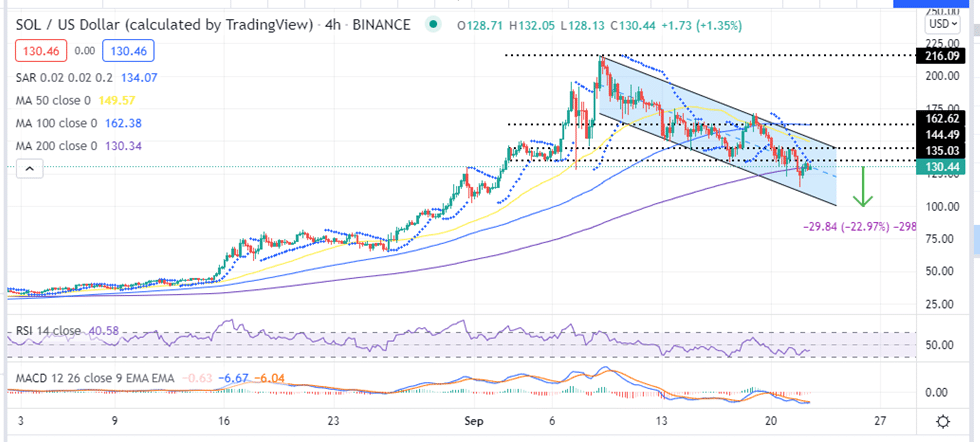
Solana’s bearish narrative is validated by the down-sloping moving averages and the negative Parabolic SAR which indicate that the SOL market momentum is bearish.
In addition, the Moving Average Convergence Divergence (MACD) indicator is moving below the signal line. Furthermore, the MACD’s position below the neutral line in the negatiev region accentuates Solana’s bearish outlook.
These bearish technical indicators plus the fact that SOL faces stiff resistance upwards provided by particlarly the 200-day SMA around the $130 area, the 50-day SMA at $150 and the 100-day SMA at $162.62 validate Solana’s bearish bias.
If things go well for the bulls and the asset closes the day above the immediate resistance at $135.03, SOL price may rise towards the $144 resistance coinciding with the tip of the upper boundary of the descending parallel channel. A rise further could see the Solana break out of the confines of the descending channel to tag the $160 psychological level or the 100-day SMA above it.
WhereTo Buy SOL
If you wish to know how to buy cryptocurrencies such as Solana, you can do so on the top exchanges such as eToro, Binance, OKEx, CoinTiger, HitBTC, and ZT. You can find others listed on our crypto exchanges page.
Looking to buy or trade Solana now? Invest at eToro!
Capital at risk
