- The Fed paused and held rates unchanged, but policymakers flagged the possibility of one last hike.
- The BOJ maintained its ultra-loose policy and its dovish policy outlook.
- Next week’s BOJ minutes will summarize the meeting held yesterday.
The USD/JPY weekly forecast is bullish as monetary policy divergence continues to weaken the yen against the dollar.
Ups and downs of USD/JPY
The USD/JPY pair had a bullish week, and monetary policy divergence was the primary catalyst for the move. Both the Fed and the BOJ held their monetary policy meetings this week. While the Fed paused and held rates unchanged, policymakers flagged the possibility of one last hike for 2023.
–Are you interested in learning more about forex bonuses? Check our detailed guide-
Meanwhile, the BOJ maintained its ultra-loose policy and dovish outlook for the future of interest rates. This decision saw the yen plunge. At the same time, the dollar was rising, leading to a bullish close for USD/JPY.
Next week’s key events for USD/JPY
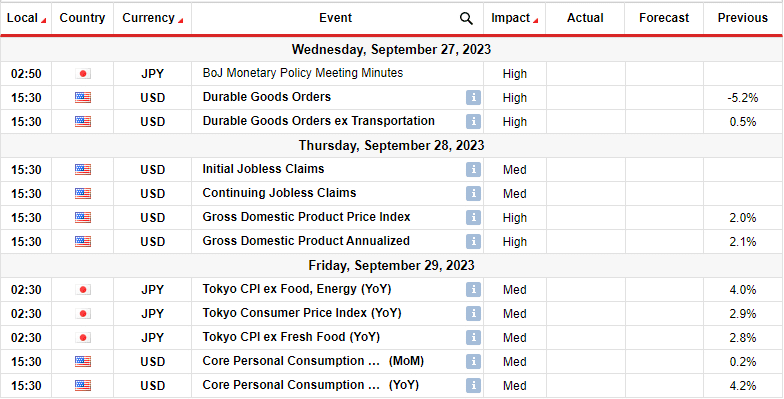
Japan will release the BOJ monetary policy meeting minutes and Tokyo’s inflation figures in the coming week. On the other hand, investors will focus on the US’s GDP and core personal consumption figures. The BOJ minutes will give a summary of the meeting held yesterday. The minutes will help investors understand what went into the recent policy decision.
The US GDP figures are crucial to show whether the Fed will achieve a soft landing. If the economy is robust, it might allow the Fed to implement one more hike. Meanwhile, the core PCE figures will show the inflation state, influencing the Fed’s next move.
USD/JPY weekly technical forecast: RSI shows bulls’ vulnerability.

The USD/JPY price is bullish on the daily chart, with the price above the 22-SMA and the RSI near the overbought region. However, bulls have weakened. This weakness can be seen in the price action and the RSI.
–Are you interested in learning more about ETF brokers? Check our detailed guide-
Price action shows a shallow move above the 144.77 critical level, with the price riding on the SMA. Therefore, bulls are no longer making big swings above the SMA. On the other hand, the RSI shows weakness with a bearish divergence. While the price is making higher highs, the RSI is making lower highs. It signifies that momentum is fading, and bears might soon take over.
Bears will take over when the price breaks below the 22-SMA. The price would then likely retest the 144.77 support level.
Looking to trade forex now? Invest at eToro!
68% of retail investor accounts lose money when trading CFDs with this provider. You should consider whether you can afford to take the high risk of losing your money
