- BTC/USD seesaws in a range above 10,930 following the previous day’s downpour.
- RSI conditions question the optimists but a trend line support from October 2019 stops the bears.
- August 2019 top can lure the bulls beyond the latest high, multiple supports await sellers during the fall.
BTC/USD follows the general market pullback while picking up the bids near 11,170, up 0.90% on a day, during early Monday. The Bitcoin major dropped heavily on Sunday but couldn’t slip beneath a slightly downward sloping trend line from October 26, 2019. As a result, buyers remain hopeful amid upbeat MACD conditions.
Hence, July 27 top around 11,720 and Saturday’s high of 11,883 can become their immediate favorites during the further upside.
However, overbought RSI conditions may again challenge the buyers near Sunday’s peak of 12,115, if not then August 2019 top near 12,325 will be on their radars.
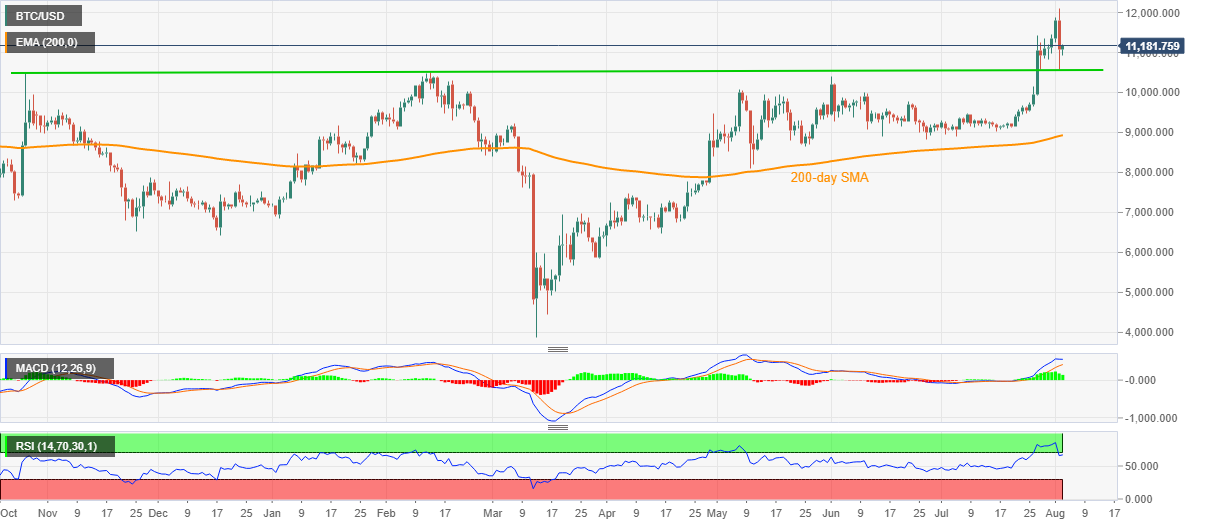
Meanwhile, a downside break below the aforementioned support line, at 10,560 now, could drag the quote to the May month’s top near 10,400. It should also be noted that there are multiple supports around 10,000 in a case where the Crypto major fails to bounce off 10,400.
BTC/USD daily chart
Trend: Bullish
