- Bitcoin has been on a great run today and leading into the Asian session BTC/USD is 3% higher.
- The 4-hour chart shows there is a key resistance level you may need to be aware of.
Bitcoin has been on a good run today holding above 10,000 as sentiment remains positive. Other safe havens in the financial markets are higher as gold is close to hitting $1550/oz.
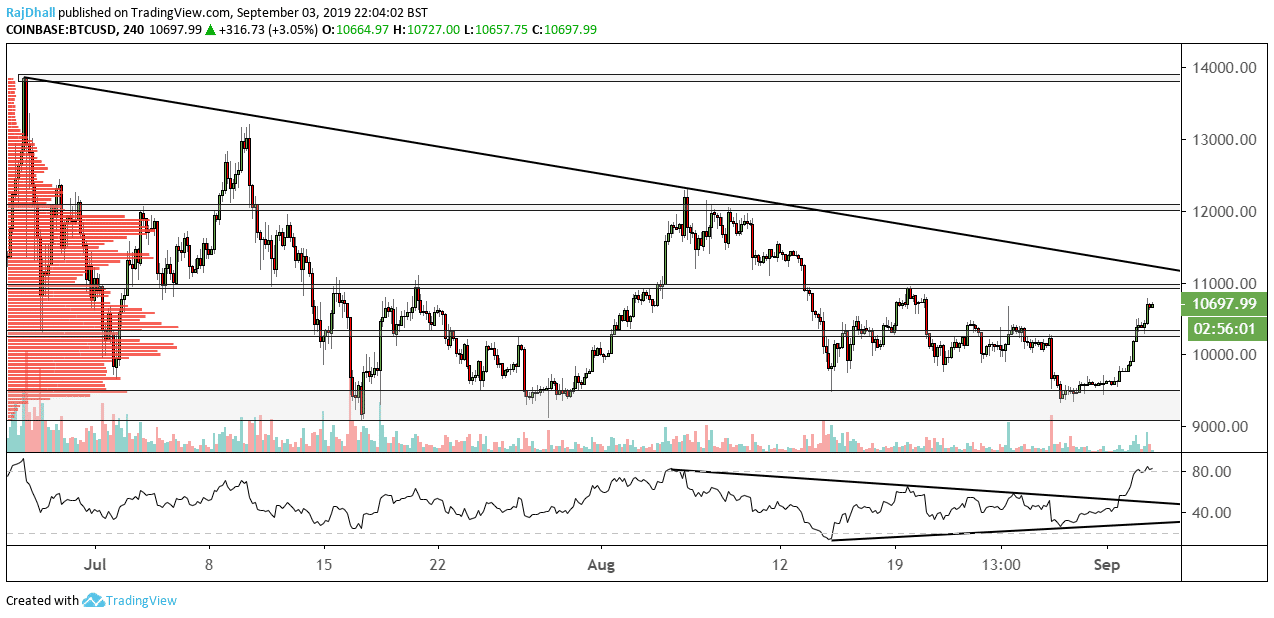
Looking at the 4-hour chart above the wave higher is pretty intense having moved from 9,333 to 10,700 today in 5 days. It’s not over yet and it seems that the 11,000 psychological level could be the target.
We are above the mean value area of this consolidation which currently stands at 10,400 and the area between this one and the consolidation above is the resistance just below 11,000. Close to this just above 11,000 is a trendline marked in black which could be a tricky level to break for the bulls.
The RSI indicator is still moving higher but is in an overbought zone. This does not mean BTC/USD will pull back but it is showing signs that it may need to slightly before moving higher once more.
