- There are some good technical signs for the Bitcoin bulls.
- The RSI on the daily is moving higher after a bullish divergence.
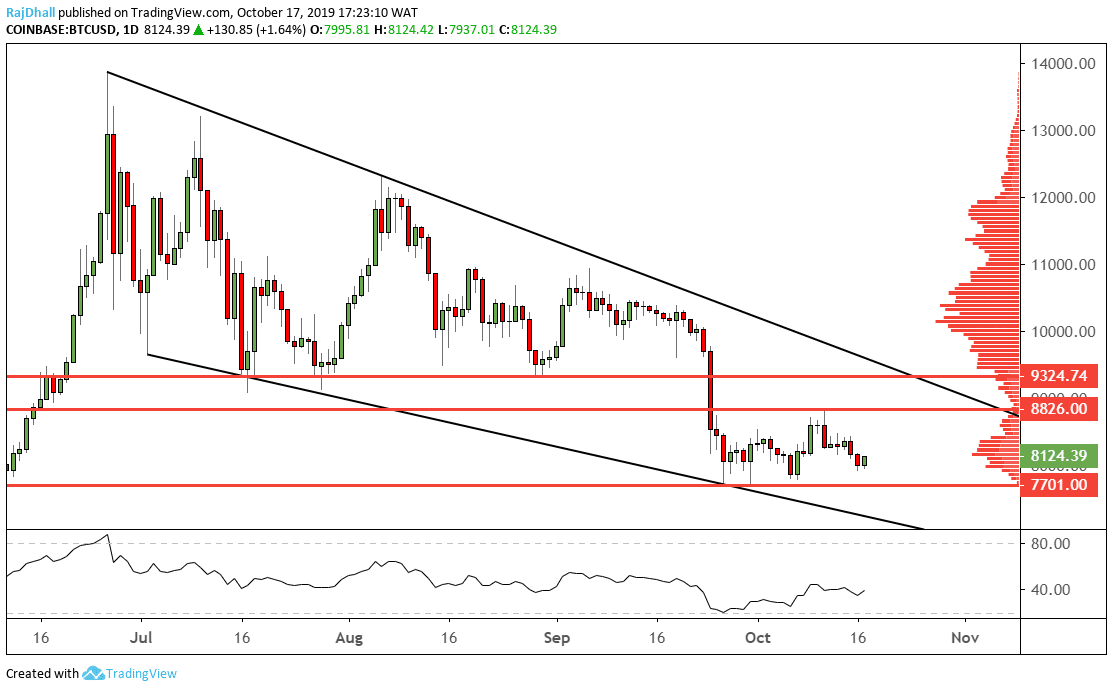
Bitcoin bulls have been through some pain recently but I am here to tell you its not all bad news.
The daily chart is showing some signs that the downward momentum may be slowing down.
The relative strength index (RSI) indicator is making higher low waves while the price made a few lower lows. This is called bullish divergence and can sometimes indicate a change in trend.
If today’s candle also closes higher than 8,171.59 it would also fully engulf yesterday’s bear candle and it is also considered a bullish signal.
The four-hour chart also has some good points to keep an eye on. On the relative strength index (RSI) indicator there momentum line has just broken above the trendline.
Another major signal would be if the trendline on the chart is broken to the upside. However, the 8,217.47 resistance stands in the way of further progress.
The aforementioned resistance is also close to the value area represented by the volume profile indicator on the right-hand side of the chart.
That level also needs to be taken out by the bulls to provide more confidence in the next rally, if there is to be one.

