- Cardano price has triggered a symmetrical triangle pattern with a measured move of -60%
- Monday’s low at $1.18 may halt a massive ADA decline.
Cardano price revealed a symmetrical triangle on the 24-hour chart revealing ADA’s price consolidation as the two trendlines converge. With a potential breakout downwards, ADA is on the brink of a massive decline that may test the dynamic support provided by the 200-day Simple Moving Average (SMA).
Cardano Price Struggles to Hold above $1.30
The 18% drop on June 19 through the ascending 2021 trendline was a significant warning crypto signal to ADA optimists and formed a new range of resistance for Cardano price that was created by a confluence of the trendline and the 50-day SMA. The bulls attempted to stabilize the downward rally with a doji candlestick on June 22, but the ensuing price action indicates indecision in the market as volume numbers plunged. At the moment, selling price and buying price appears to be at an equilibrium.
The symmetrical triangle pattern may be triggered within the next few days. If this happens, it will expose Cardano price to a massive decline. The measured move of the ADA asymmetrical triangle us approximately 60%, pointing to a final low of $0.44. A fall of that magnitude would slide through the 200-day SMA dynamic support at $1.11, the long-term support at $1 and the lows of the 2021 trendline defined on February 05 at $0.39.
If ADA closes the day below Monday’s low of $1.18, it will be a confirmation of a new bearish breakout from the symmetrical triangle pattern. The next crucial support for Cardano price is the June 22 low of $0.98 as well as the 200-day SMA, which represents a 23% decline from the current price at $1.27.
An alternative ADA support level is the February 8 high of $0.83, marking a 34% decline from the current Cardano price. A continuation downwards to the measured move target at $0.44 would be a shock to investors.
Cardano Price (ADA/USD) Daily Chart
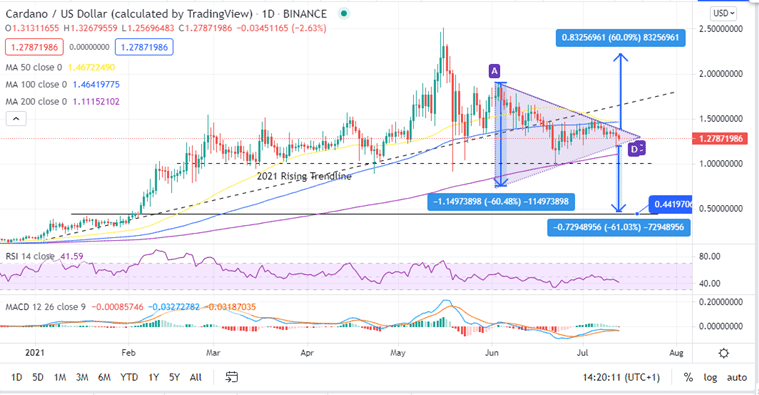
The Relative Strength Index (RSI) indicator accentuates this bearish outlook as it makes a sharp dive away from the midline towards the oversold zone. This shows, at the moment, the downward trend is strong as bears are rallying to push ADA price even lower.
A look at the other side
On the upside, the psychologically important $1.30 level may reverse curtail the ADA sell-off, but it will take a close above $1.40 to initiate a recovery of the Cardano price. If this happens, Cardano price will encounter serious resistance at the 50-day and 100-day SMA at around $1.47 and the June 2 high of $1.9.
You can follow the Cardano price from this list of Best Cryptocurrency Trading Platform for 2021 to stay informed.
Looking to buy or trade crypto now? Invest at eToro!
Capital at Risk
