- Cardano price managed to break out from an ascending triangle pattern on the 12-hour chart.
- The price target of $0.25 remains realistic as on-chain metrics show ADA faces very little resistance on the way up.
Cardano price had a major 13% jump after a clear breakout from an ascending triangle pattern on the 12-hour chart. Despite the significant pump, it seems that the digital asset still has more room to climb.
Cardano price continues aiming for $0.25
After the breakout of the ascending triangle pattern on the 12-hour chart, bulls have been in full control of the trend. ADA aims for $0.25 in the long-term as it faces very little resistance above according to many indicators.
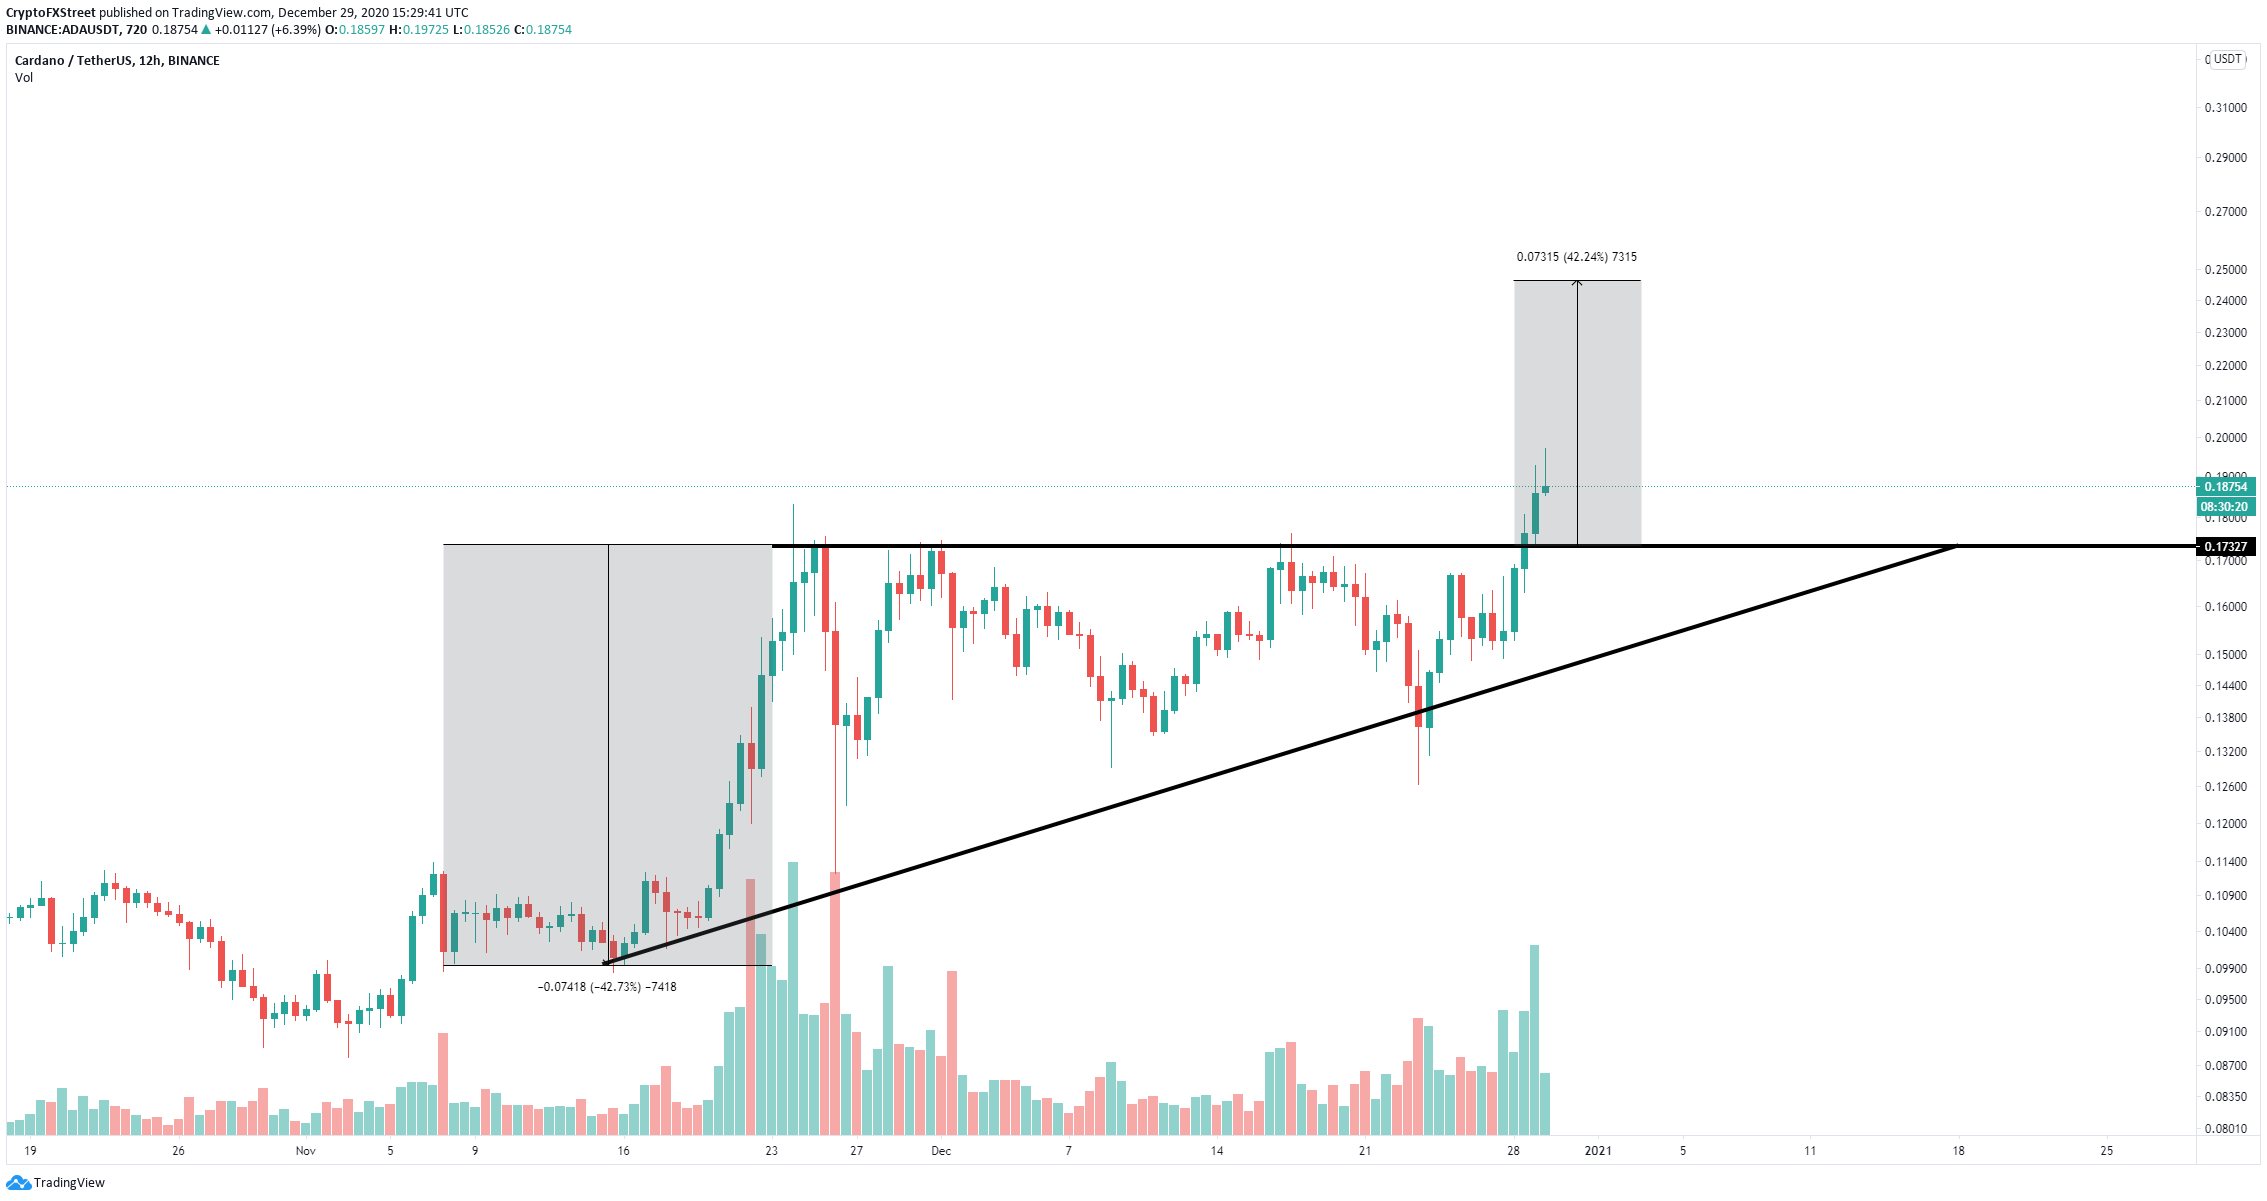
ADA/USD 12-hour chart
The In/Out of the Money Around Price (IOMAP) chart shows virtually no resistance above $0.18 well until $0.21. This indicates that bulls won’t face many difficulties pushing ADA through several resistance levels.
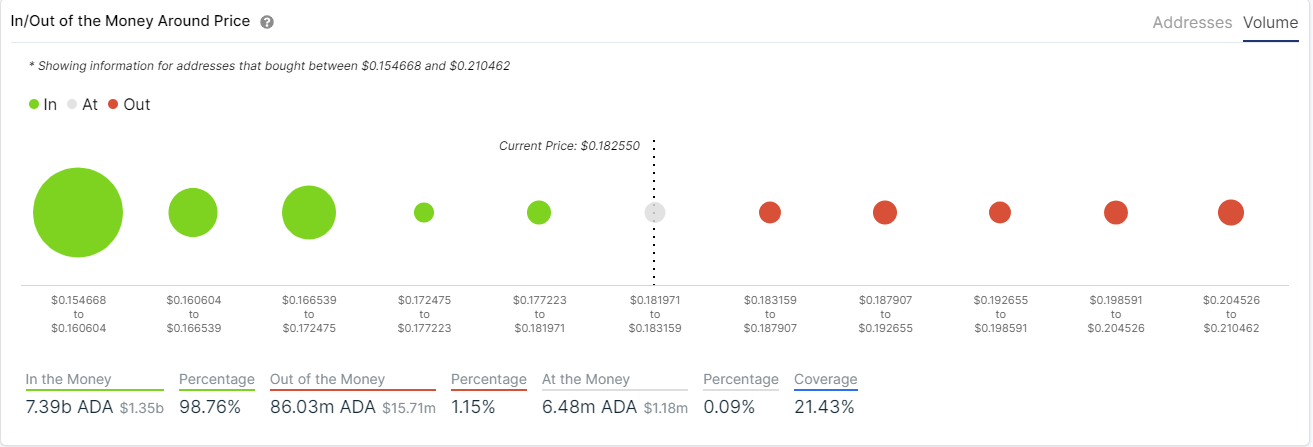
ADA IOMAP chart
However, the IOMAP chart also shows very little support until the area between $0.166 and $0.172 which coincides with the previous resistance trendline. After a breakout, it’s often the case that an asset will drop back to re-test the previous resistance, which in this case coincides with what the IOMAP says, giving credence to this bearish outlook.
