- Cardano price has been contained inside a long-term inverse head and shoulders pattern on the weekly chart.
- It seems that ADA has finally broken out of the pattern and aims for a 90% move to the upside.
Cardano was up by 35% in the past two days after a significant breakout from a crucial long-term pattern formed on the weekly chart. Bulls target a price of $0.32 in the medium term as the entire market has turned bullish.
Cardano price targets $0.32 with very little resistance above
The most significant pattern was the inverse head and shoulders on the weekly chart which has been broken. The next price target for the bulls is $0.32 which would be a two-year high, although the all-time high is set at $1.26.
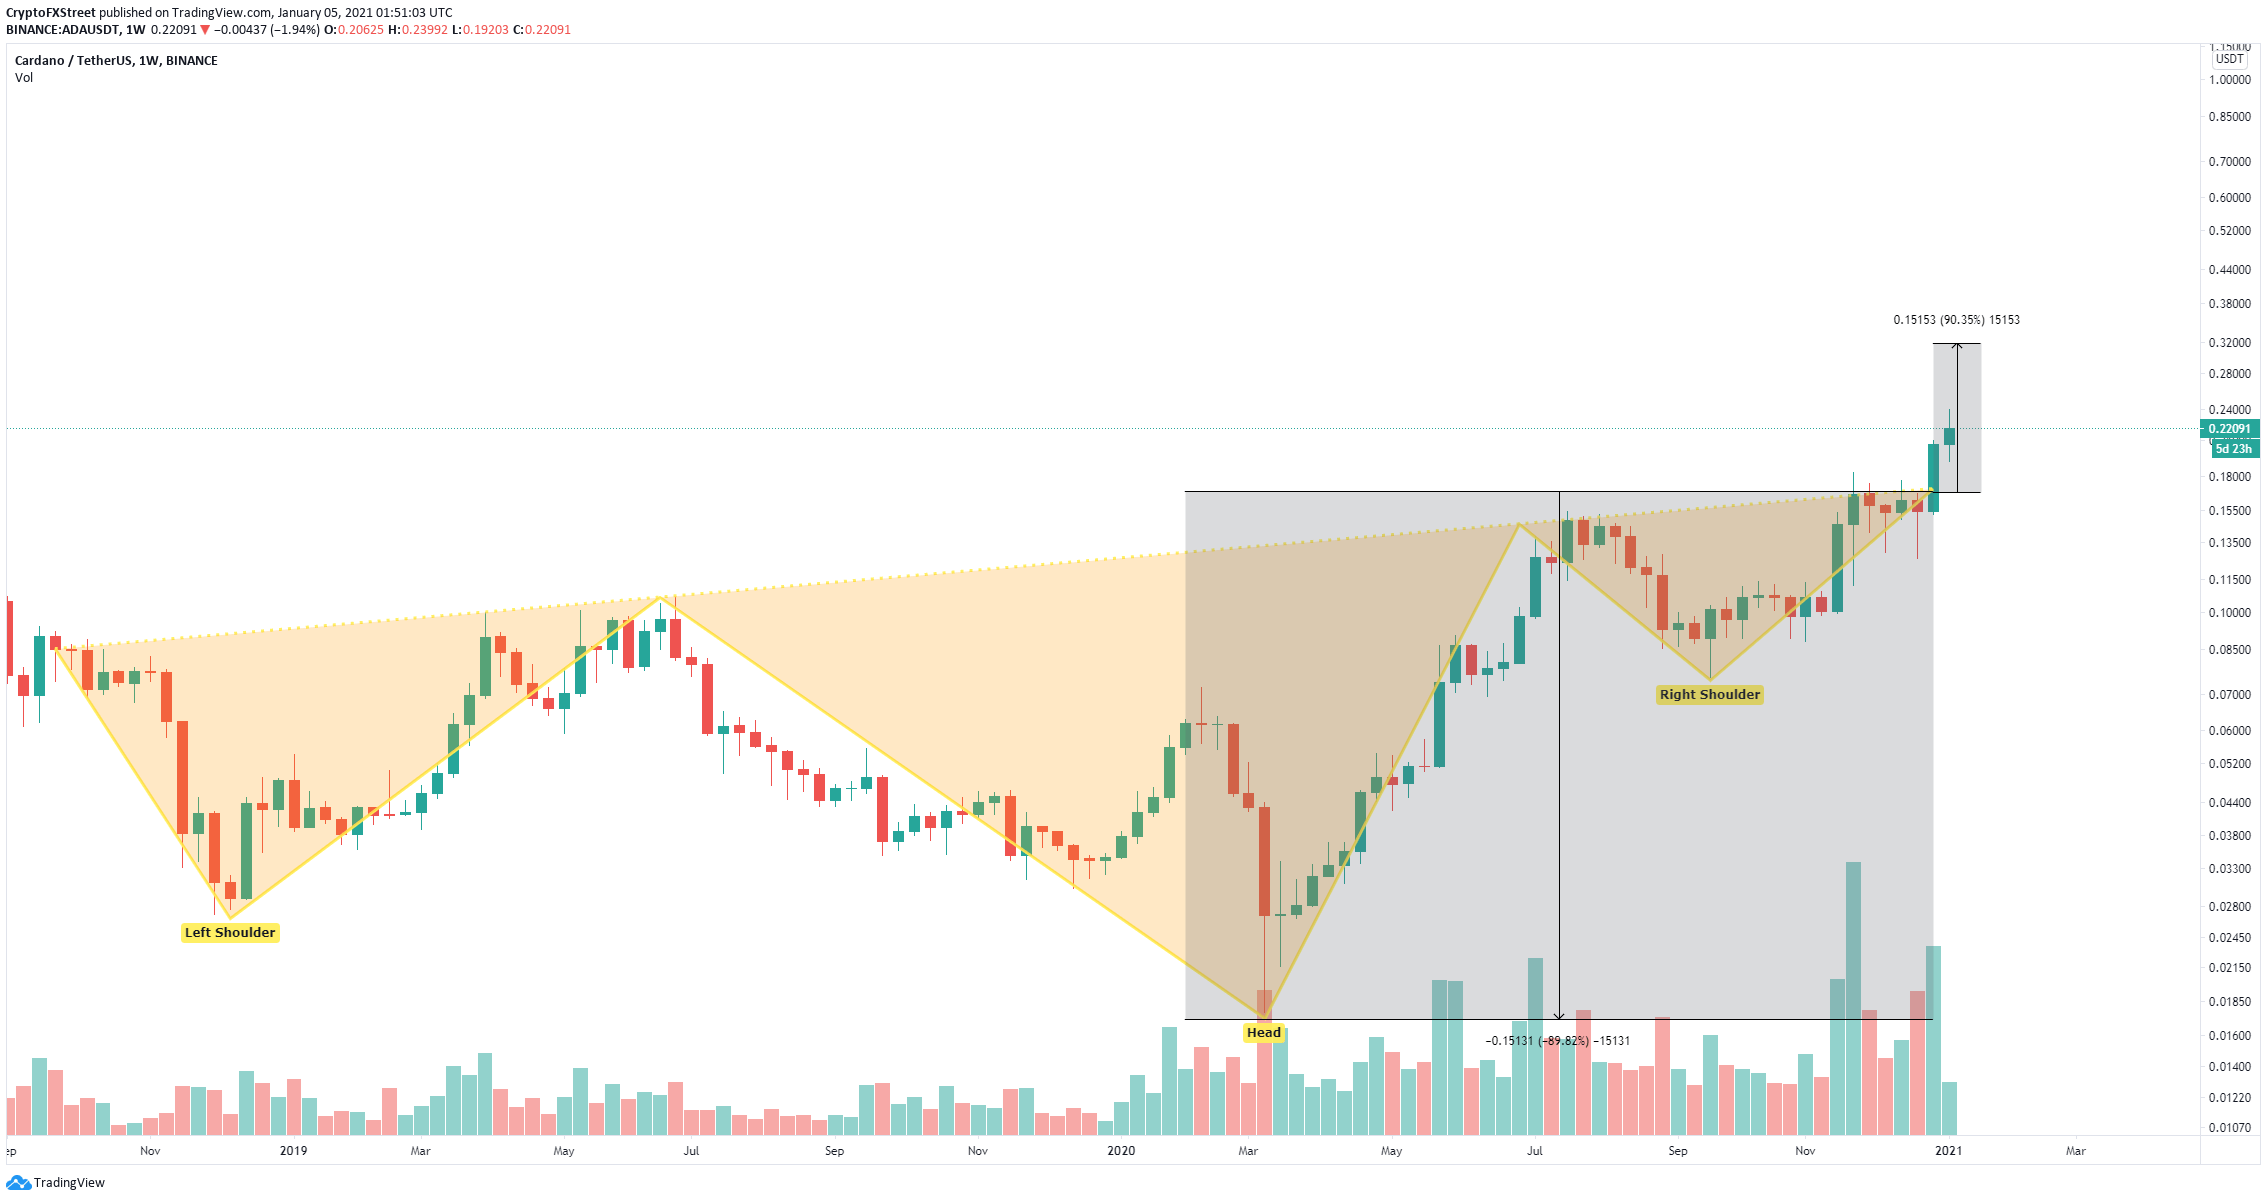
ADA/USD weekly chart
The In/Out of the Money Around Price (IOMAP) chart shows lower resistance ahead in comparison to the support below. The most significant resistance area is located between $0.21 and $0.23. A breakout above this point will quickly push Cardano price towards $0.25.
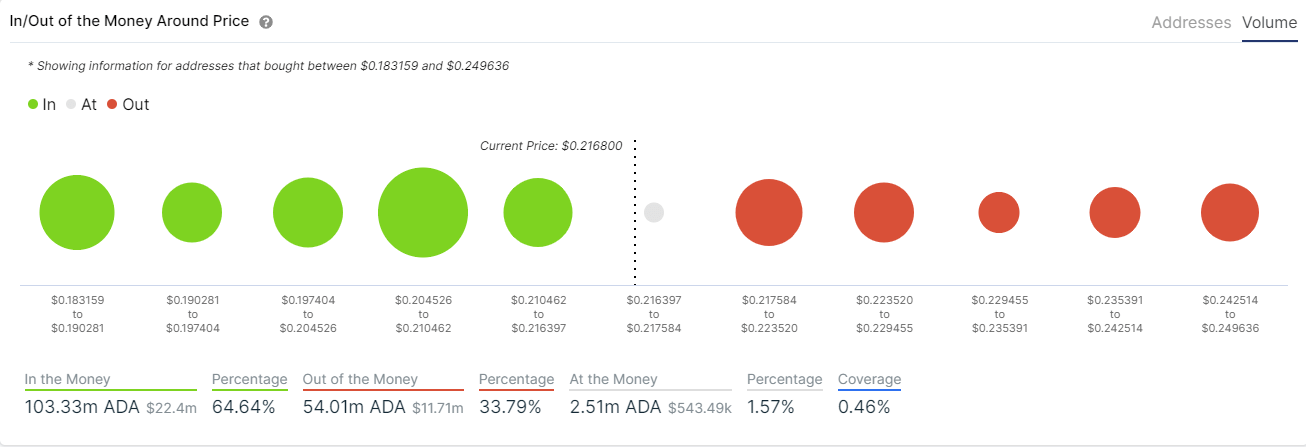
ADA IOMAP chart
Bears hope to crack the crucial support area between $0.20 and $0.21 which would push Cardano price down to $0.187. The lowest bearish price target would be $0.168 which was the resistance neckline of the inverse head and shoulders pattern on the weekly chart.
