- ADA is currently trading at $0.1 after a notable 41% price surge over the past week.
- The outlook for Cardano is quickly turning bearish as several indicators are showing a potentially deadly selloff.
Cardano established a new 2020-high on July 26 at $0.15. The digital asset is down 50% since its peak, and it’s currently trying to recover.
Several indicators are pointing towards a selloff
Although ADA price has been trending upwards, it seems that many indicators are starting to shift in favor of the bears.
ADA/USD daily chart
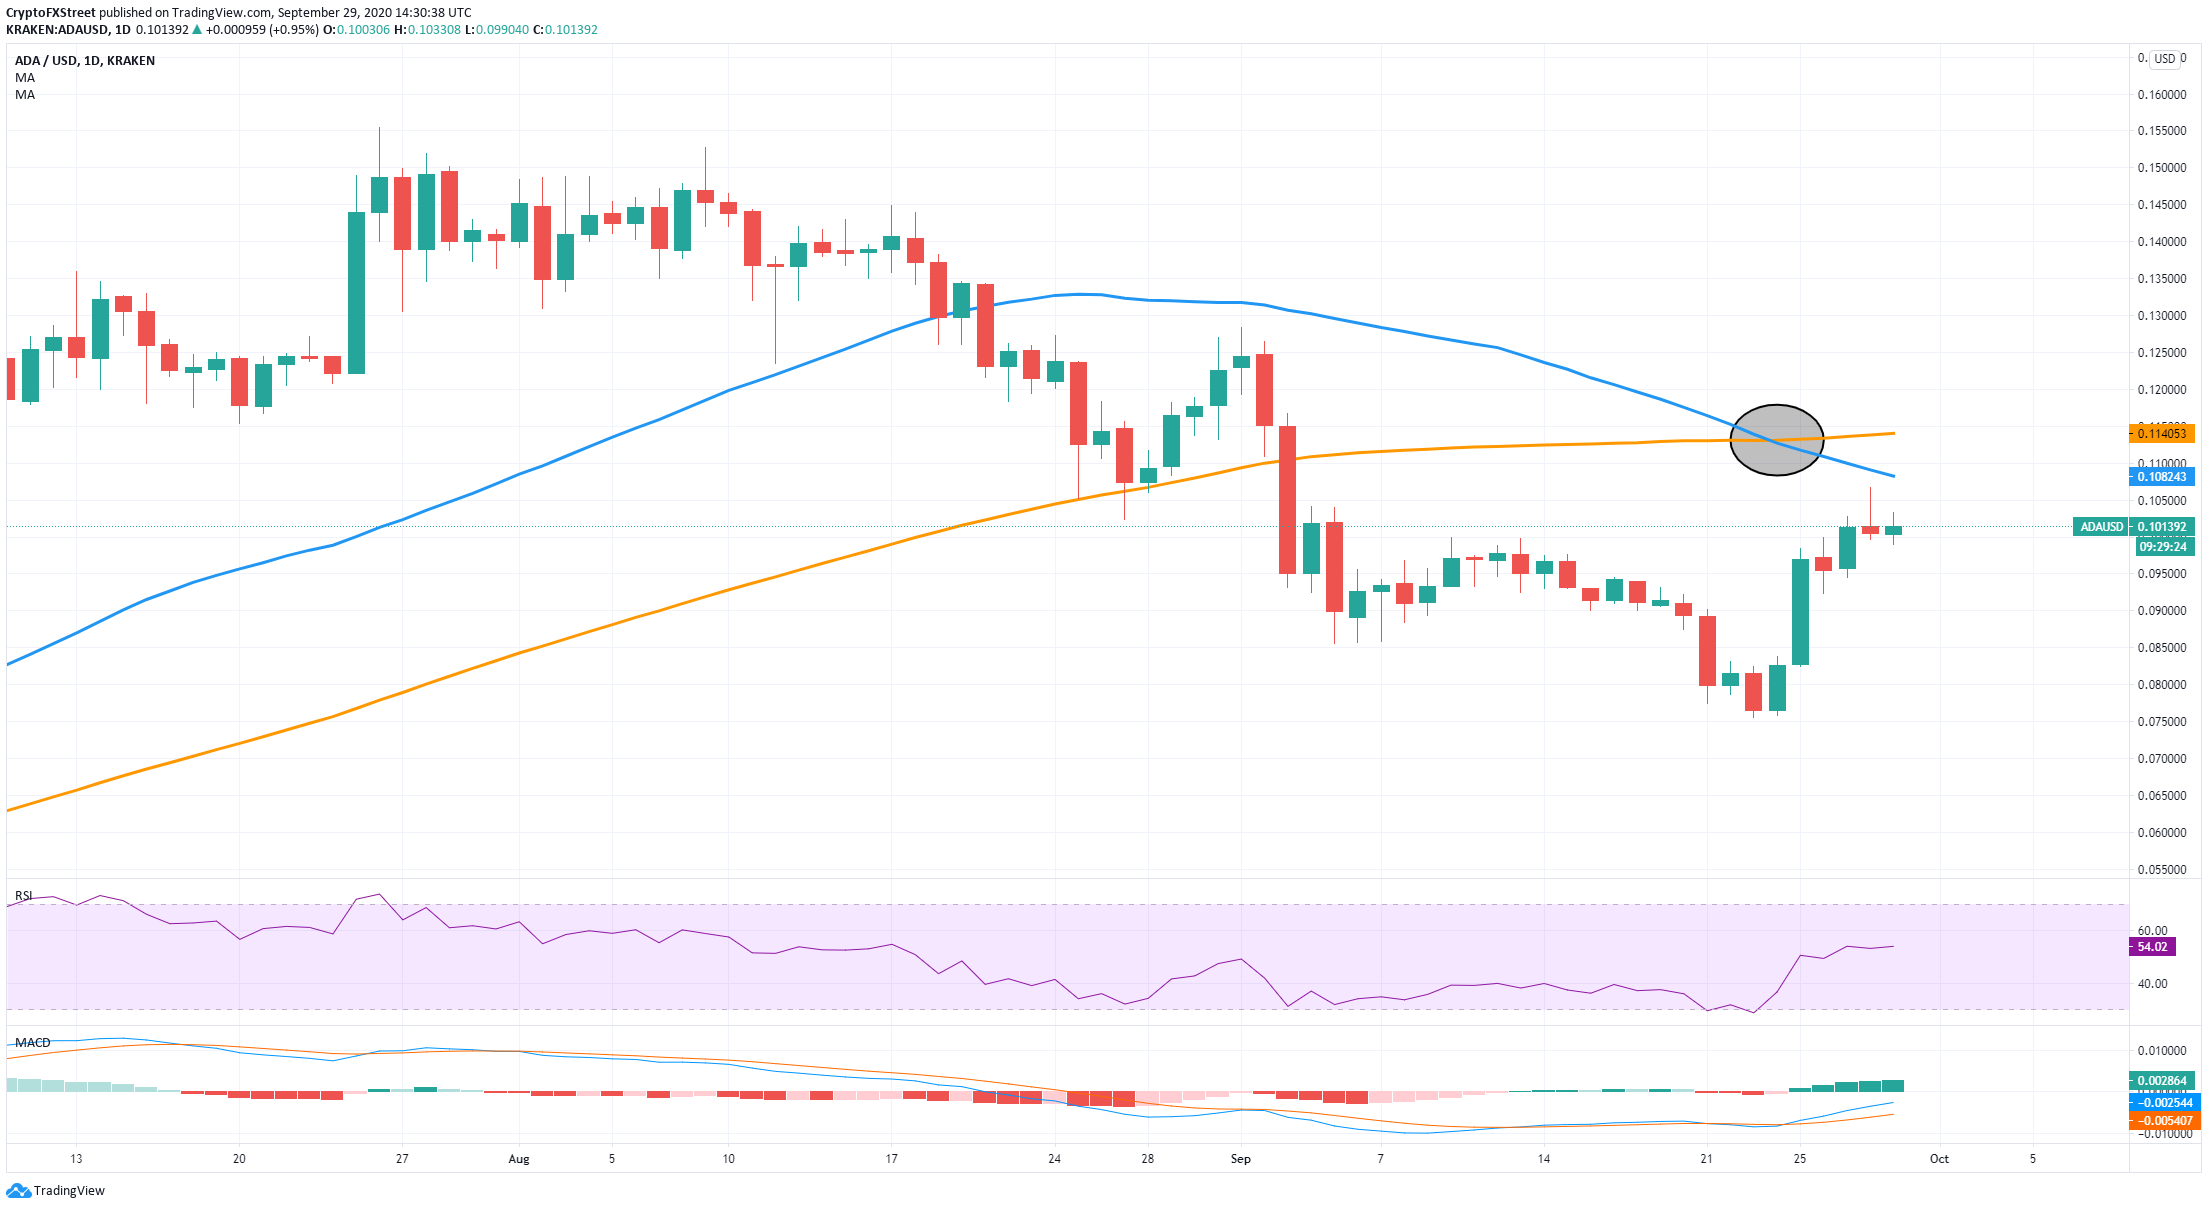
On the daily chart, the 100-MA and the 50-MA had a death cross on September 23. This pattern indicates the potential for a major selloff even though ADA is rebounding. The 50-MA at $0.108 will act as a resistance level in the upcoming days.
ADA IOMAP Chart
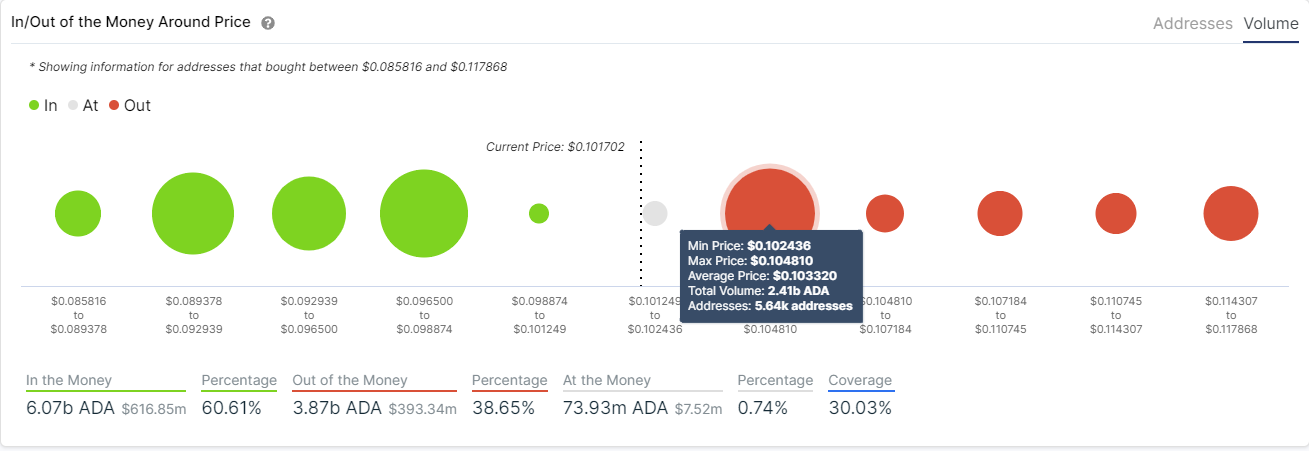
Looking at the In/Out of the Money Around Price chart by IntoTheBlock, it certainly seems that bulls face a lot of resistance ahead. The range between $0.102 and $0.104 is a giant resistance level where more than 5,000 addresses bought 2.4 billion ADA coins.
ADA Holders Distribution Chart
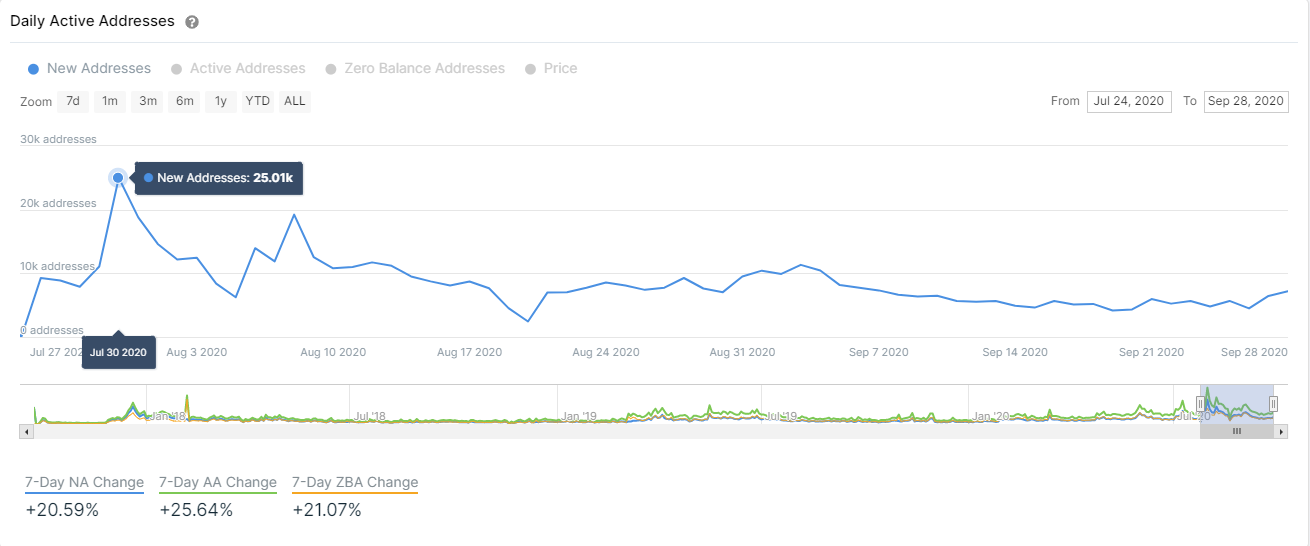
The theory that ADA bulls are slowing down is also supported by the distribution holders chart. The metric shows a significant decrease in the number of new addresses from July 30 to now. It reveals a lack of interest in the cryptocurrency compared to before.
ADA/USD 12-hour chart
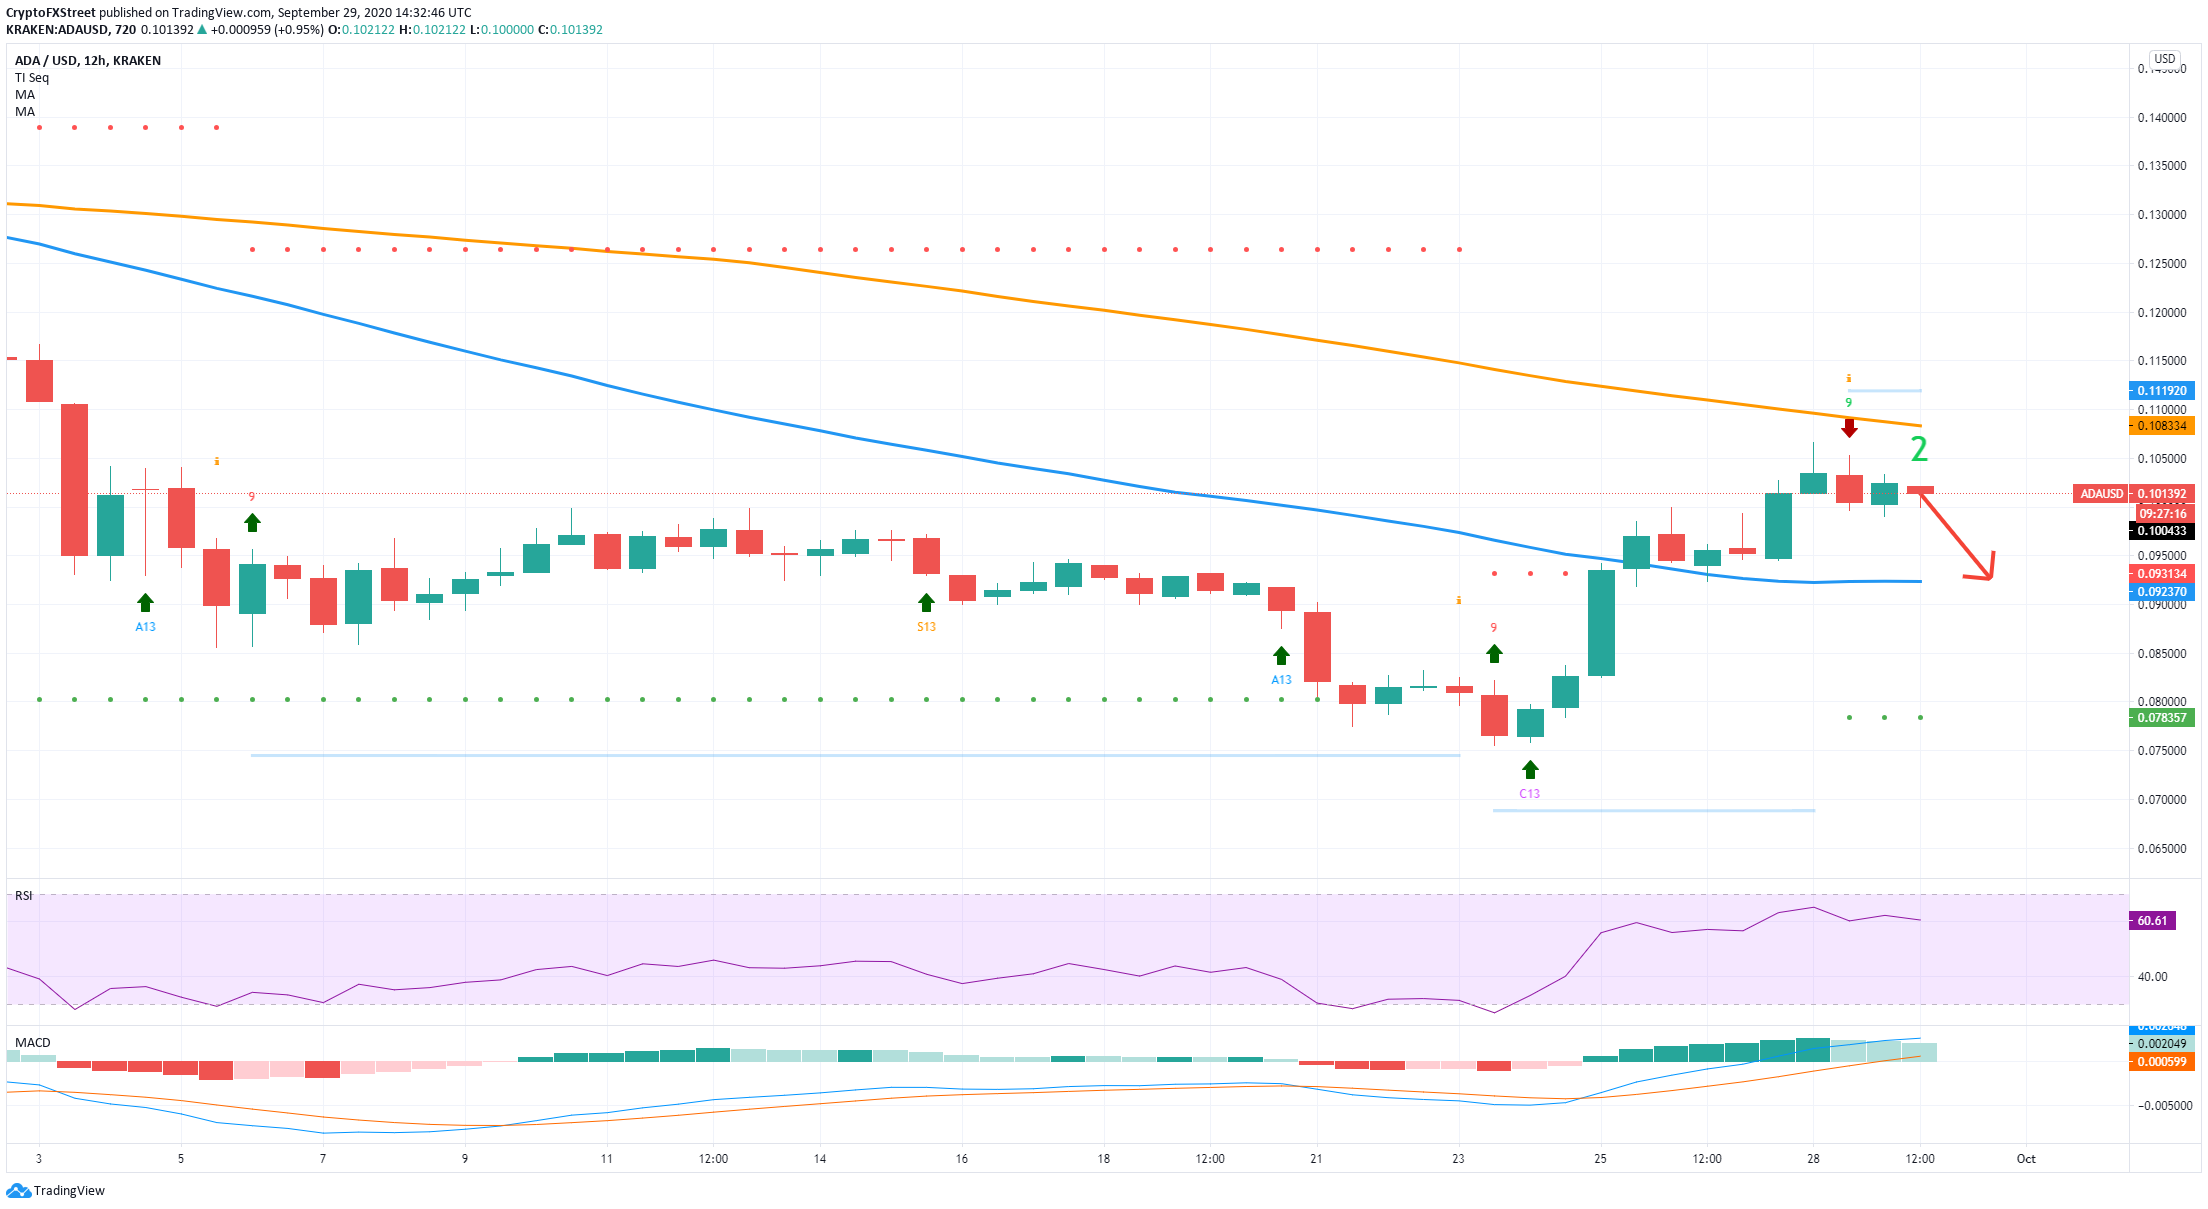
On the 12-hour chart, the TD sequential indicator has presented a sell signal on September 28. ADA faces the 100-MA at $0.108 as a resistance level, and bears are looking at least for a re-test of the 50-MA at $0.092. The RSI is also quite extended, while the MACD remains bullish.
ADA/USD 4-hour chart
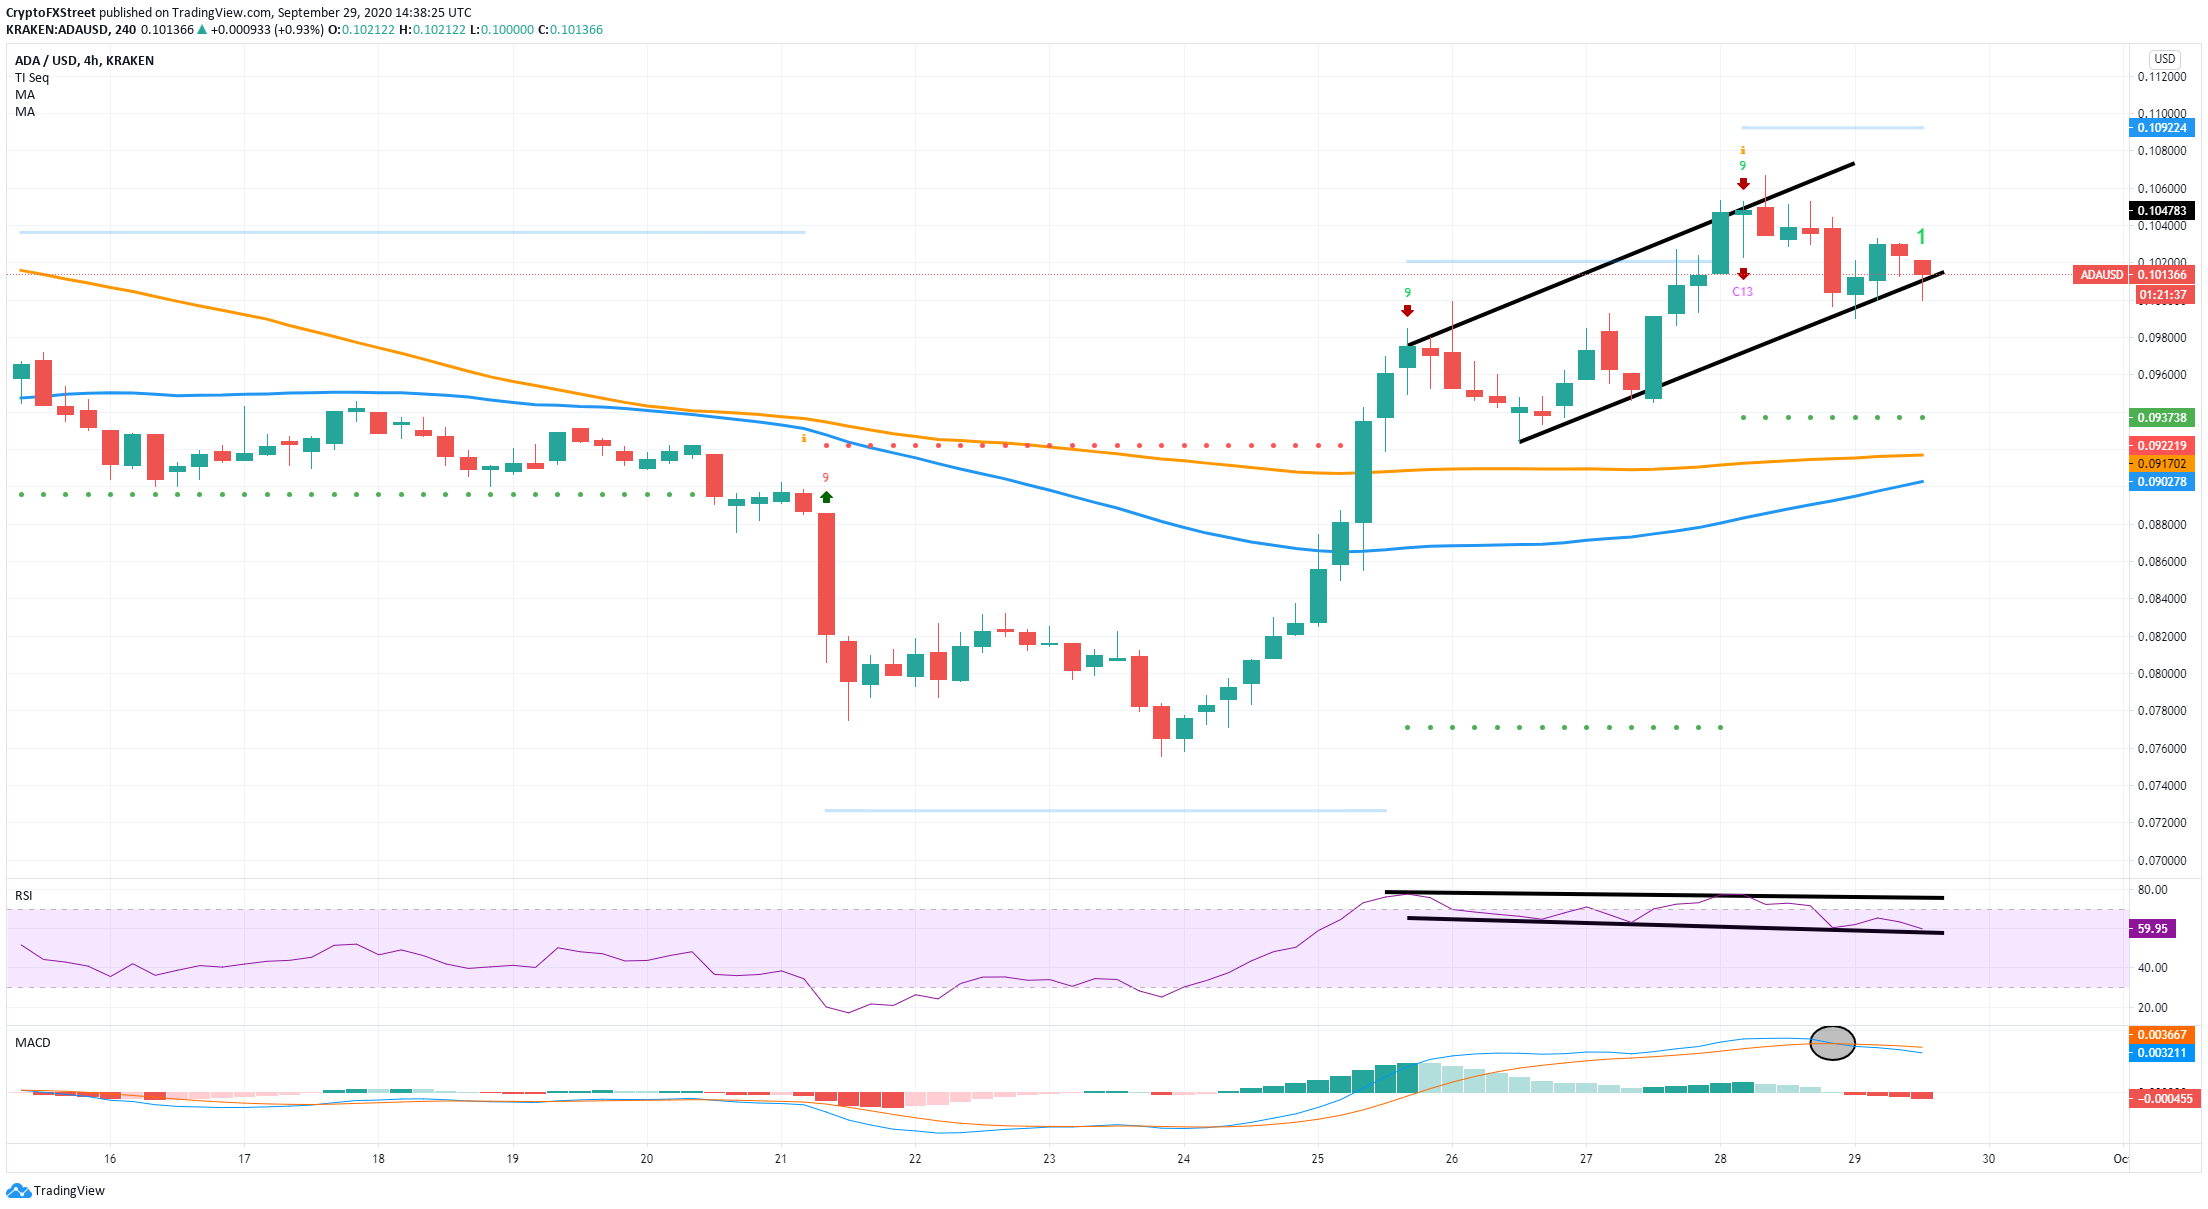
The RSI and the price have created a bearish divergence, which happens when the price posts higher highs, but the RSI doesn’t. Additionally, the MACD just crossed bearishly, and the TD sequential indicator presented another sell signal around 36 hours ago.
The bearish outlook is solid; however, the IOMAP chart shows a ton of support below $0.10. Bears still need to be extremely careful as the only significant resistance level is established between $0.102 and $0.104, meaning that ADA can continue with its recent uptrend if this area is cracked.
