- Cardano price broke out of a descending triangle pattern on the 1-hour chart.
- A key indicator has just presented a sell signal in the same time frame.
- Bulls aim for a long-term price target of $1.5.
Cardano has been trading sideways since its high of $1.48 established on February 27. The digital asset just had a significant breakout from an important pattern and aims for a high of $1.5 in the long-term.
Cardano price needs to hold key support level
Cardano formed a descending triangle pattern on the 1-hour chart from which it broke bullishly. The digital asset has not seen a lot of bullish continuation just yet and the TD Sequential indicator has just presented a sell signal which can push Cardano down to the previous resistance trendline at $1.21.
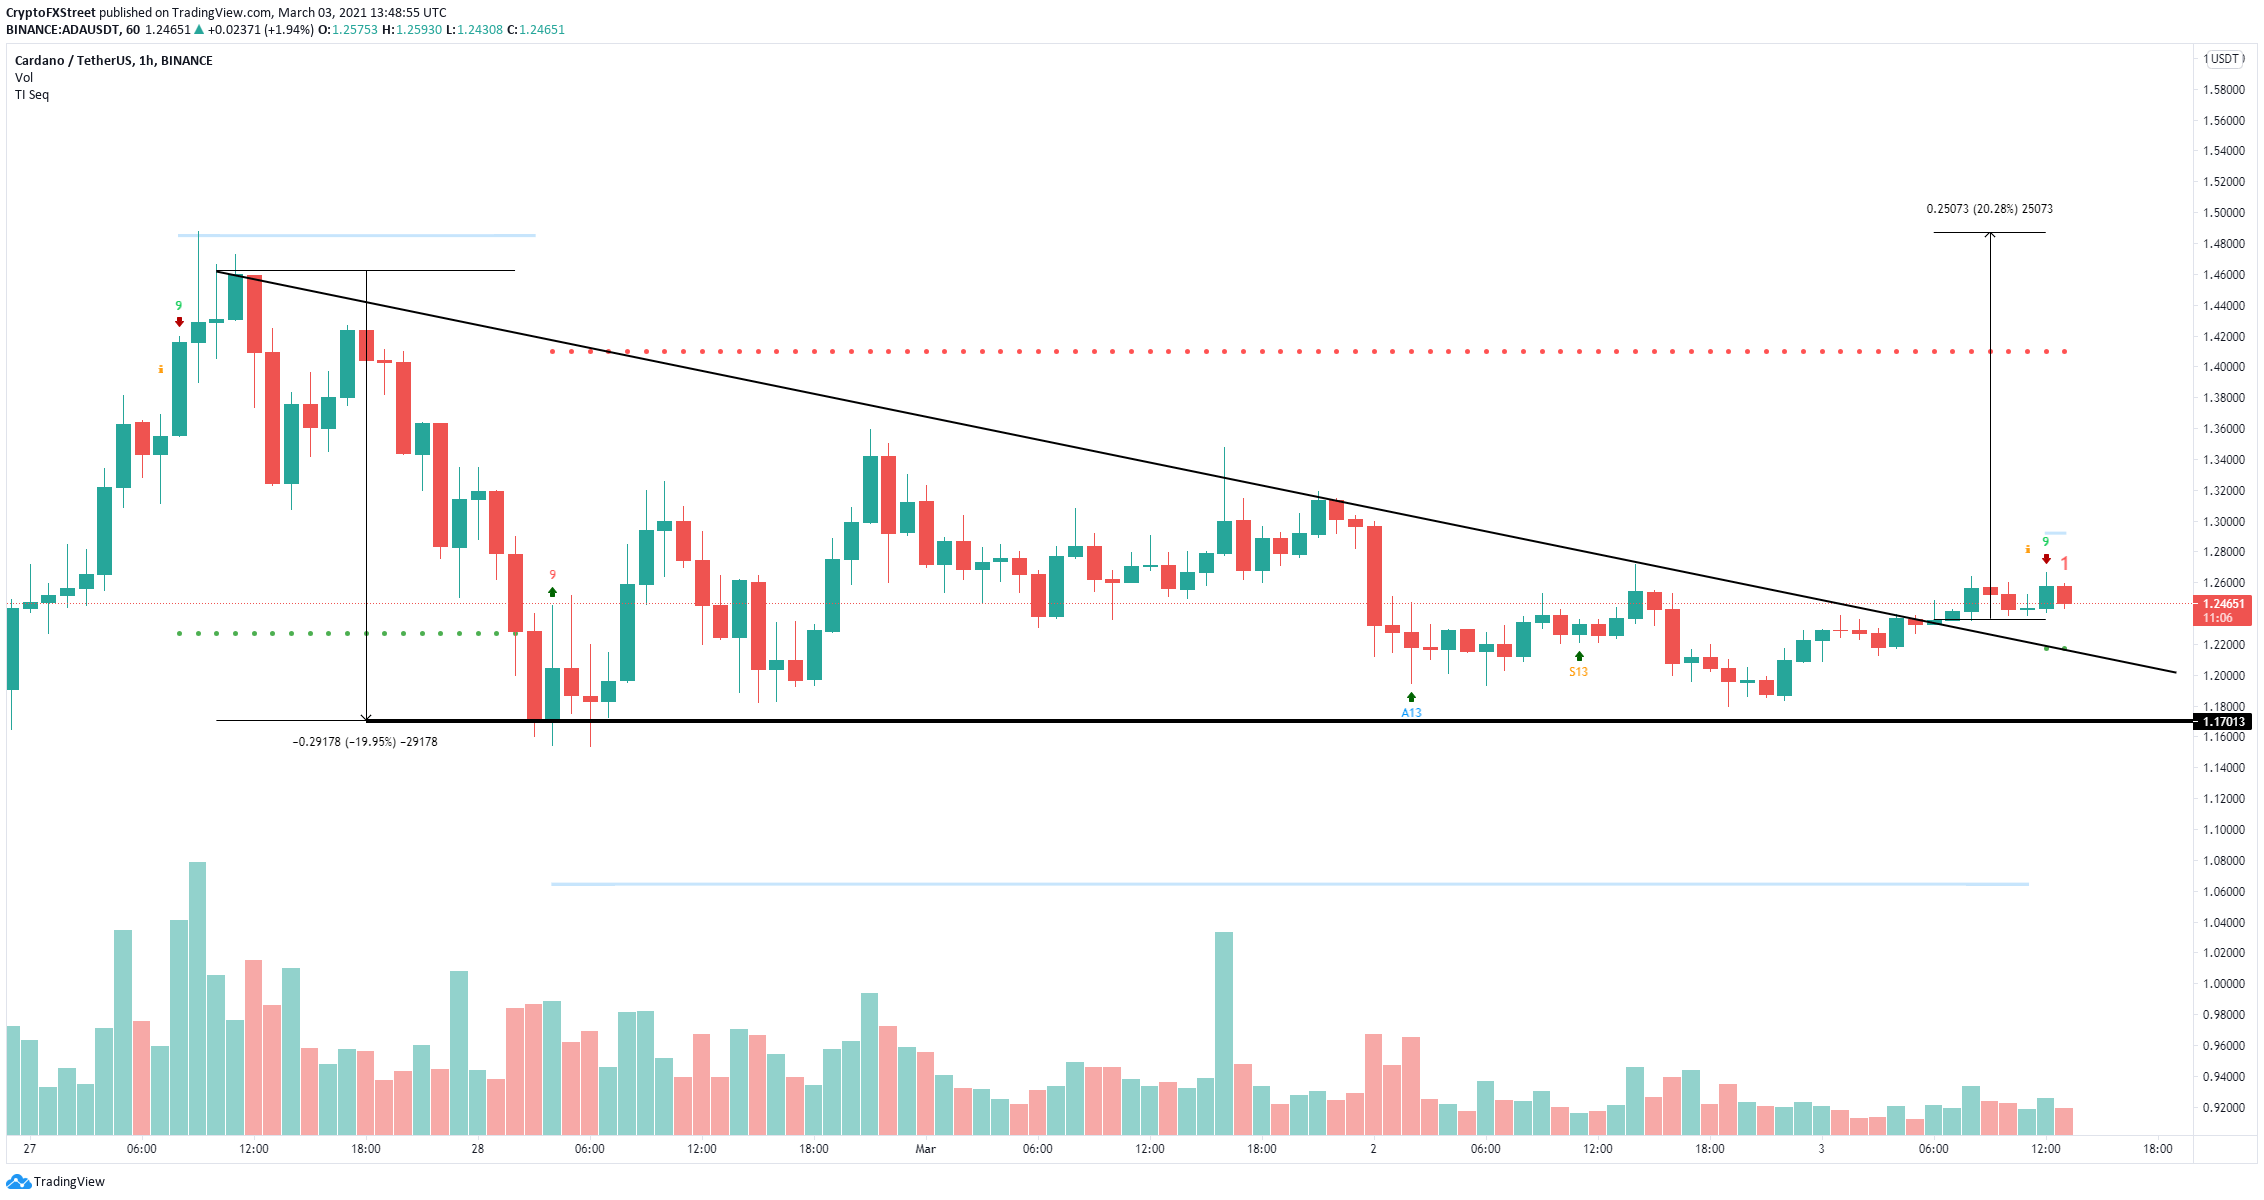
ADA/USD 1-hour chart
However, as long as the bulls can defend the key support level at $1.21, the long-term price target of $1.5 will remain intact. In order to invalidate the sell signal, Cardano needs to climb above the previous high of $1.266.
