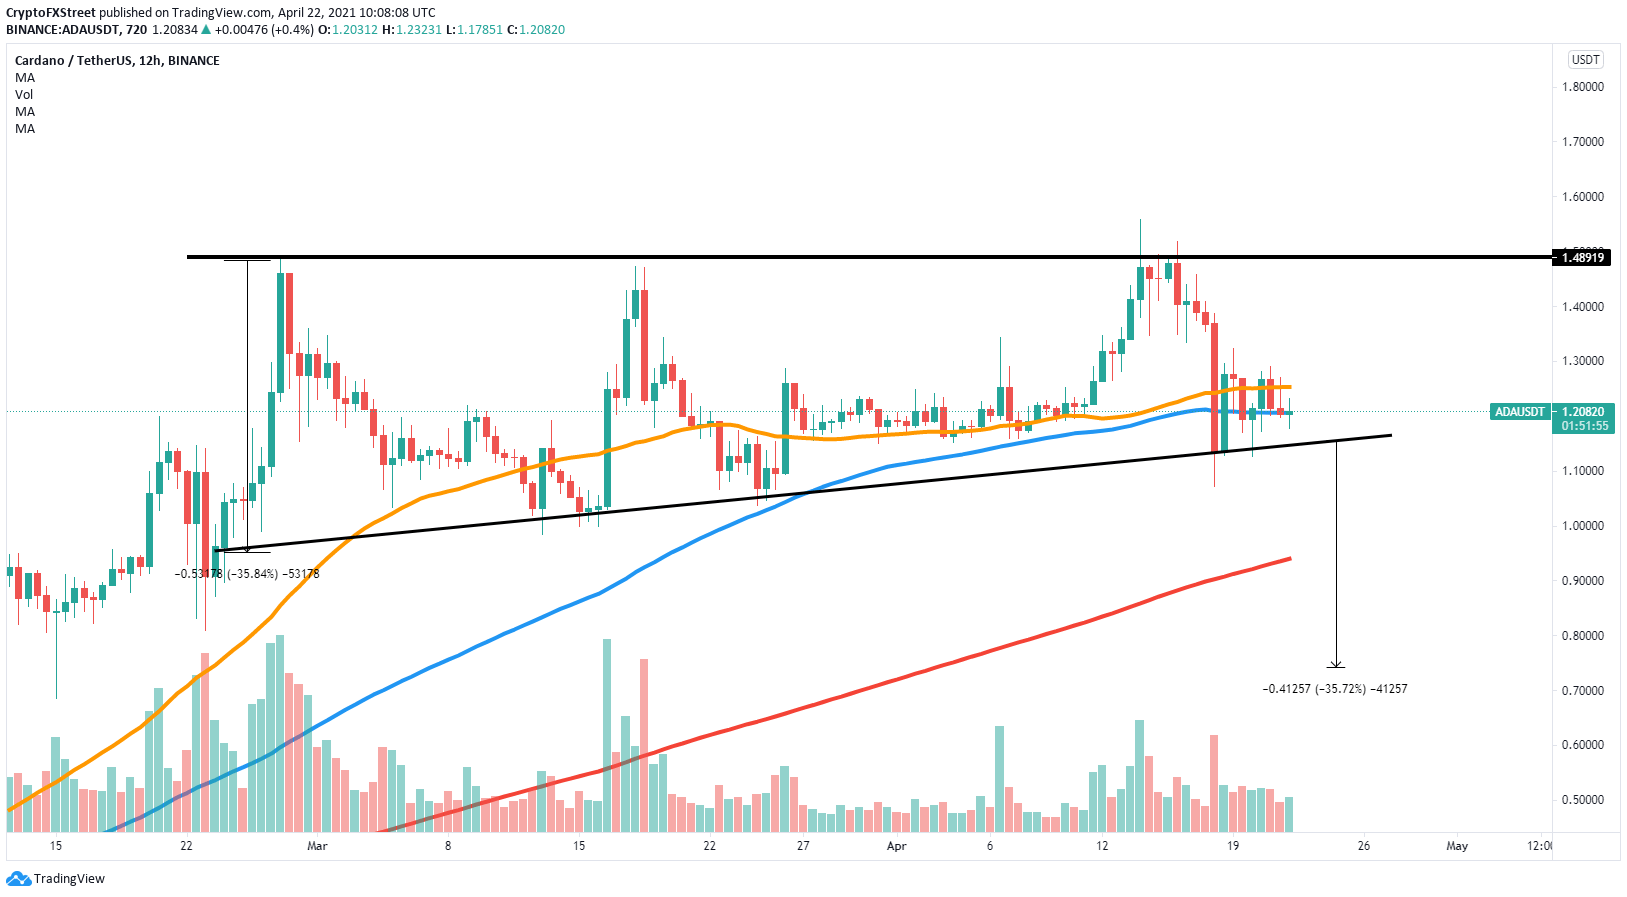
- Cardano price is contained inside an ascending triangle pattern on the 12-hour chart.
- ADA has lost a critical support level and could be on the verge of another drop.
- Bulls must hold the last key support point to avoid another crash.
Cardano has been trading somewhat sideways for the past two months and established a massive resistance trendline around $1.5. The digital asset could be on the brink of a significant leg down if bulls can’t hold key support level.
Cardano momentum shifts in favor of the bears
On the 12-hour chart, Cardano established three tops at around $1.5 and has formed an ascending triangle pattern. The digital asset has also lost the 50 and 100 SMA support levels.
ADA/USD 12-hour chart
The most significant support trend line is located at $1.15. A 12-hour candlestick close below this point would be devastating and could drive ADA toward the 200 SMA at $0.94 and as low as $0.74, a price target calculated using the initial height of the pattern as a reference point
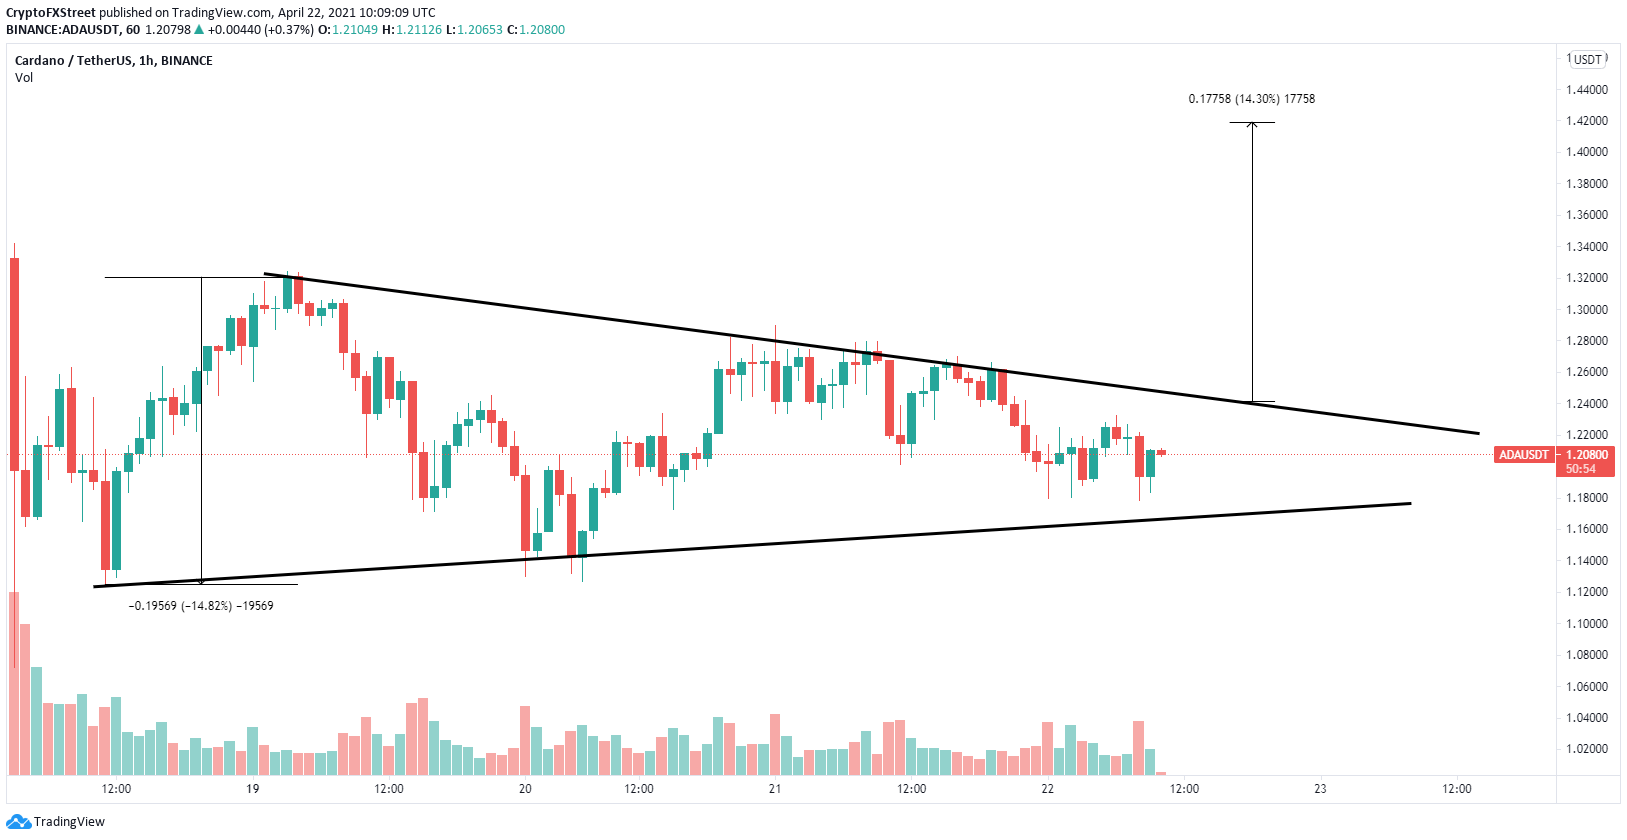
However, if bulls can hold the key support trend line, they could aim for a breakout of a symmetrical triangle pattern formed on the 1-hour chart
ADA/USD 1-hour chart
The resistance point here is formed at $1.24. A 1-hour candlestick close above this point has a price target of $1.41.


