- Cardano is currently trading at $0.09 after a major 33% crash in the past five days.
- Bulls are defending the daily 200-MA while the overall trading volume continues declining.
Cardano had a colossal rally towards $0.15 that started back on March 12, as most of the market. The digital asset had a 775% value increase over five months.
ADA/USD 4-hour chart
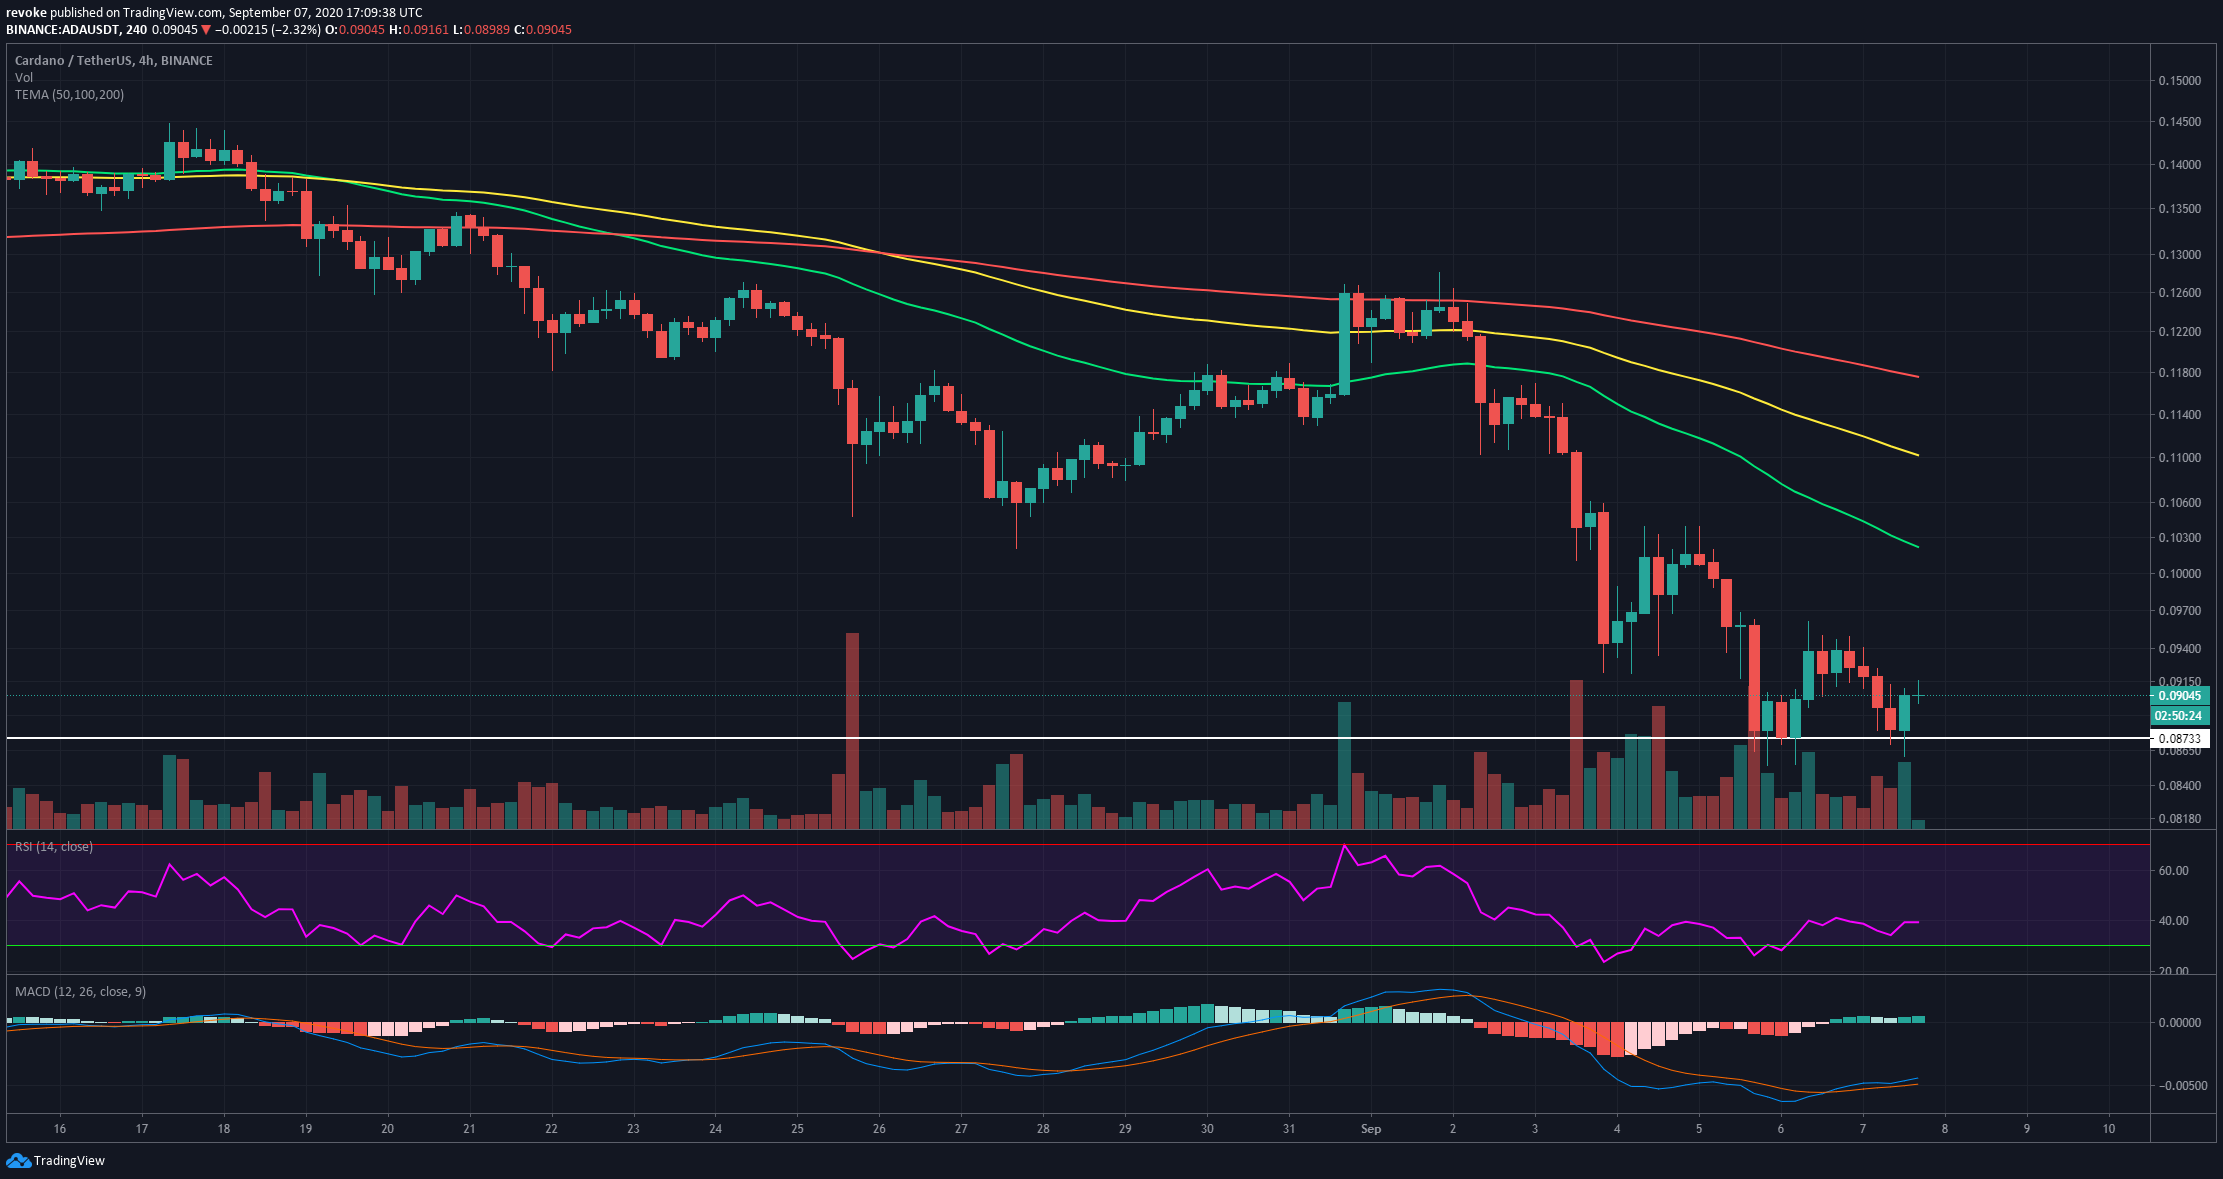
The trend is relatively straightforward, ADA is in a strong downtrend but has formed a double bottom at around $0.086, and a bounce is currently underway. Bulls have lost all three Moving Averages, which would act as resistance levels, but the nearest is over $0.10 for now.
ADA/USD 1-hour chart
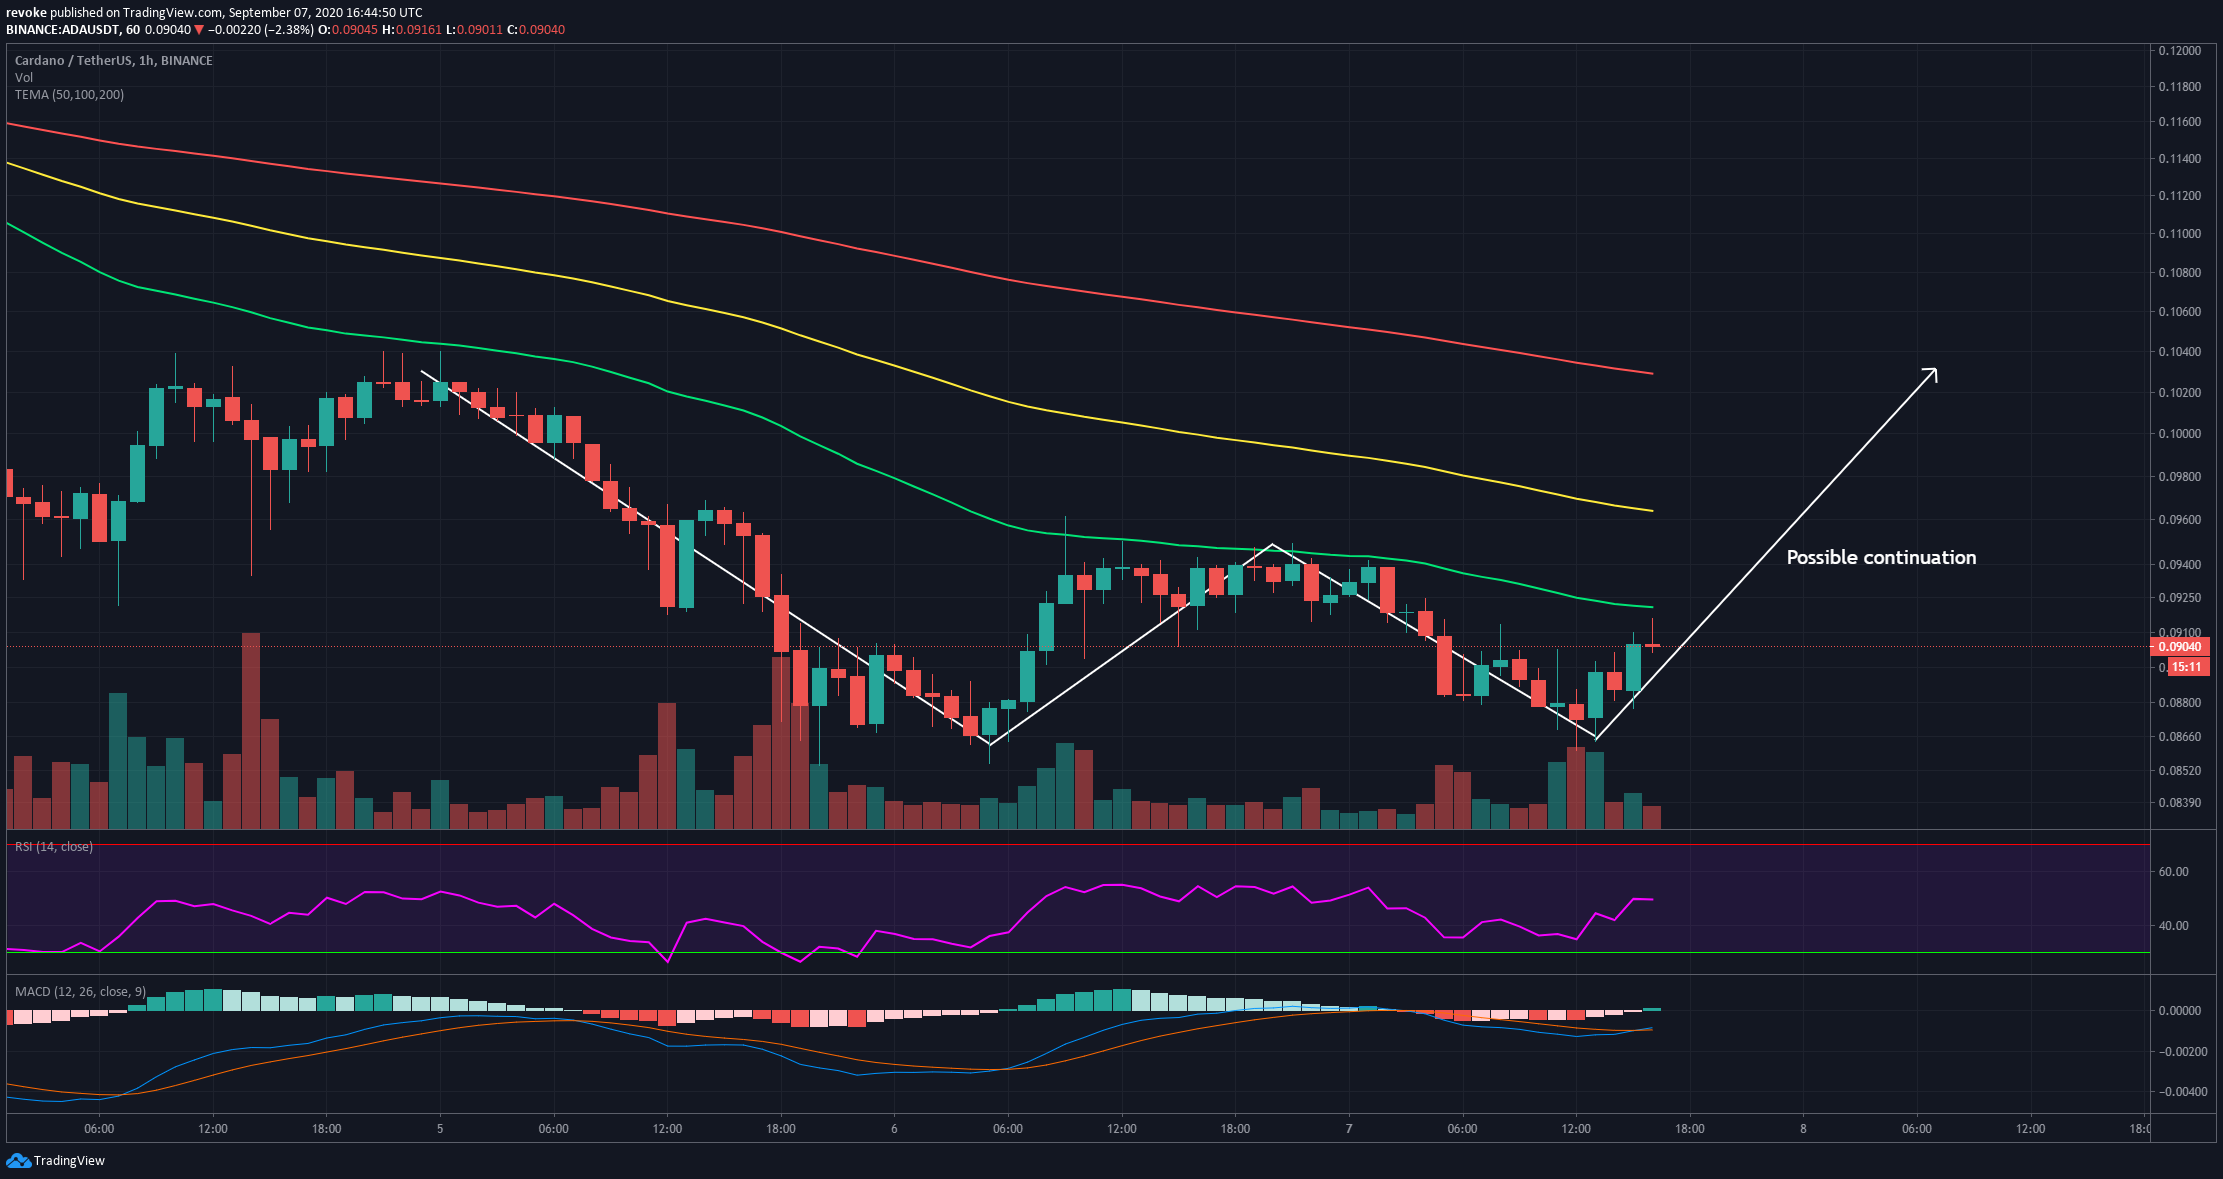
Cardano has formed a possible W pattern, also called a double bottom, although in this case, it could be considered a triple bottom. The first low was $0.0854, the second $0.0855, and now the last at $0.086. All three also coincided with overextended RSI levels
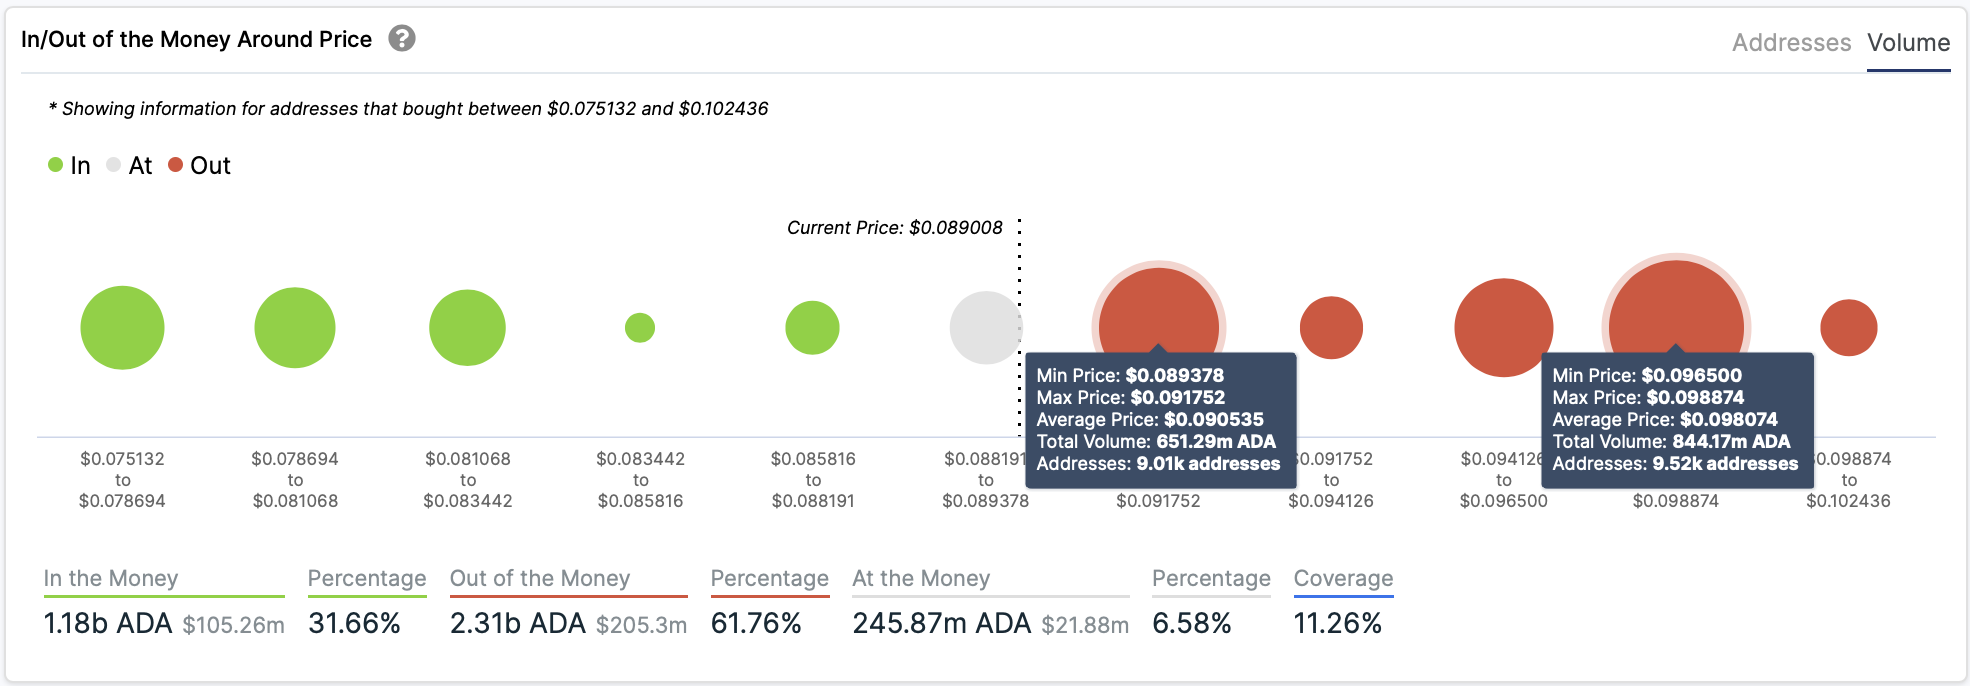
According to the IOMAP chart provided by IntoTheBlock, many addresses bought at an average price of $0.0917 and $0.098. Both levels represent high resistance areas that, if broken, would push ADA above $0.10.
ADA/USD 30-minute chart
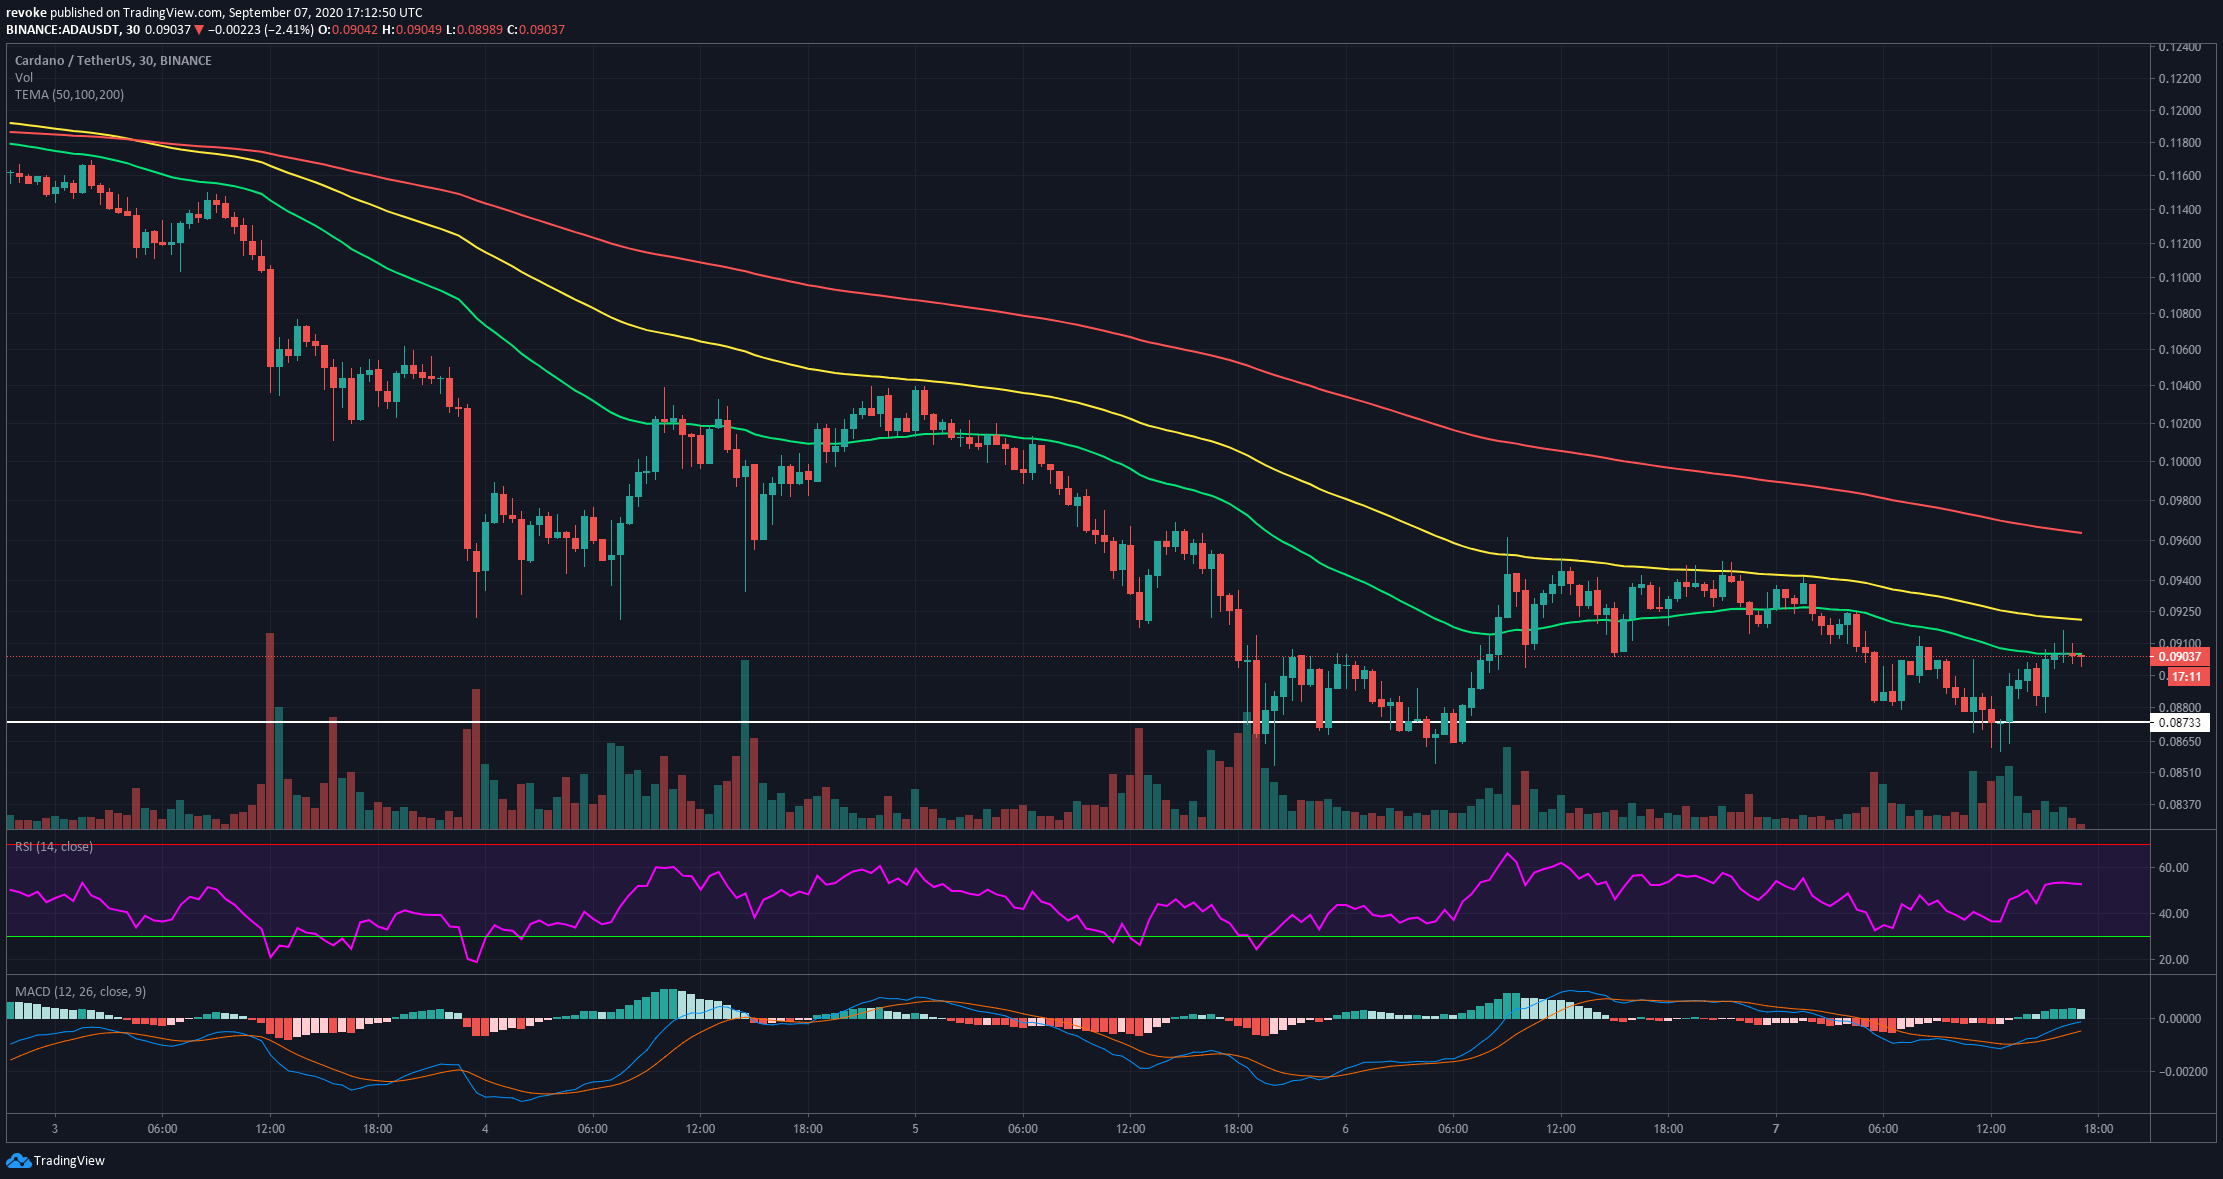
Bulls are currently struggling to climb above $0.09, which coincides with the 50-MA. They will also face more resistance at $0.092, the 100-MA. The RSI is currently right around the middle and will not pose any threat to the bulls in the short term.
