- Cardano has made a minor recovery from support at the 100 SMA, but the upside is limited under $0.28.
- On-chain metrics spell trouble as ADA bulls fight to reclaim the lost ground toward $0.34.
Cardano is in the middle of a recovery mission after bouncing off support at the 100 Simple Moving Average on the 4-hour chart. However, gains are likely to delay due to the overhead pressure, especially at the 50 SMA ($0.28).
Cardano bulls relentlessly fight to reclaim lost ground
A daily close above the 50 SMA is likely to see Cardano push the recovery mission higher. More resistance is anticipated at $0.3. If buyers can make it past these two key levels, investors currently sitting on the sidelines may join the market, and perhaps creating enough tailwind for gains beyond $0.34.
%20(27)-637460185716182737.png)
ADA/USD 4-hour chart
IntoTheBlock’s IOMPA model reveals intensifying resistance towards $0.34, where the most robust seller congestion zone lies between $0.3 and $0.31. Here, roughly 16,200 addresses previously bought nearly 1.2 billion ADA. Breaking through this zone will not be easy; therefore, bulls must brace for an uphill battle.
-637460185826655903.png)
Cardano IOMAP model
The model also reveals the lack of formidable support for Cardano, hence the possibility of a breakdown coming into the picture. For now, subtle support runs from $0.23 to $0.24. Here, about 10,500 addresses had previously bought approximately 488 million ADA.
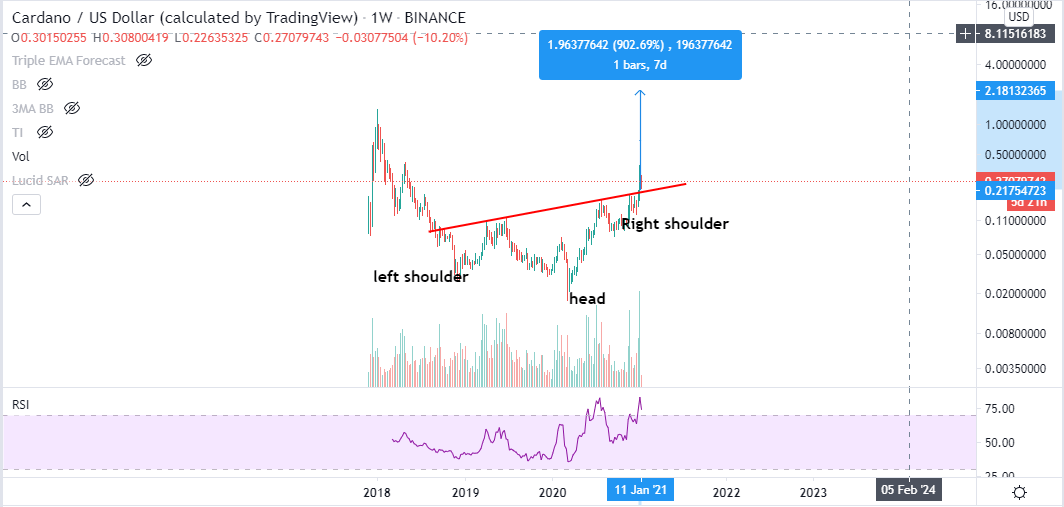
On the contrary, the weekly chart presents a massive head-and-shoulders (H&S) pattern. In technical analysis, this chart pattern is exceptionally bullish. Hence, it suggests that Cardano may turn the trend around for a massive 900% upswing to new all-time highs around $2.18.
ADA/USD 4-hour chart
Simultaneously, if the smart contract token closes the day above the short term support at $0.26, stability could return to the market. A stable market will give buyers ample time to plan the next attack at the resistance presented by the 50 SMA and the seller congestion at $0.30.
