- Cardano price stays above the hypotenuse of an ascending triangle pattern, hinting at buyers’ presence.
- Transactional data confirms the likelihood of a bounce due to a lack of resistance barriers ahead.
- However, ADA needs a decisive close above $1.48, to have a chance at 45% surge.
The Cardano price shows signs of life as it bounces off a significant demand barrier adding credibility to the bullish narrative.
Cardano price prepares for quick rally
On the 12-hour chart, the Cardano price shows the presence of aggressive buyers who have managed to create higher lows. The sellers around the $1.48 resistance level have absorbed this bullish momentum forming a series of highs in this area.
An ascending triangle pattern seems to form when the swing lows and highs are connected using trend lines. This technical formation is a continuation pattern and has an inherent bullish bias, suggesting an upswing.
Based on the setup, a decisive close above the breakout point at $1.48 indicates a 45% upswing, determined by measuring the distance between the pivot high and low at the broadest part of the ascending triangle.
Adding this distance to the breakout point reveals the Cardano price target of $2.16.
At the time of writing, ADA shows a strong bounce from the hypotenuse, indicating that it could surge toward the $1.48 level. However, Momentum Reversal Indicator (MRI) reveals the presence of State Trend Resistance at $1.35, which could deter any upside movement.
Hence, Cardano buyers must clear this level to have any chances of a bullish breakout.
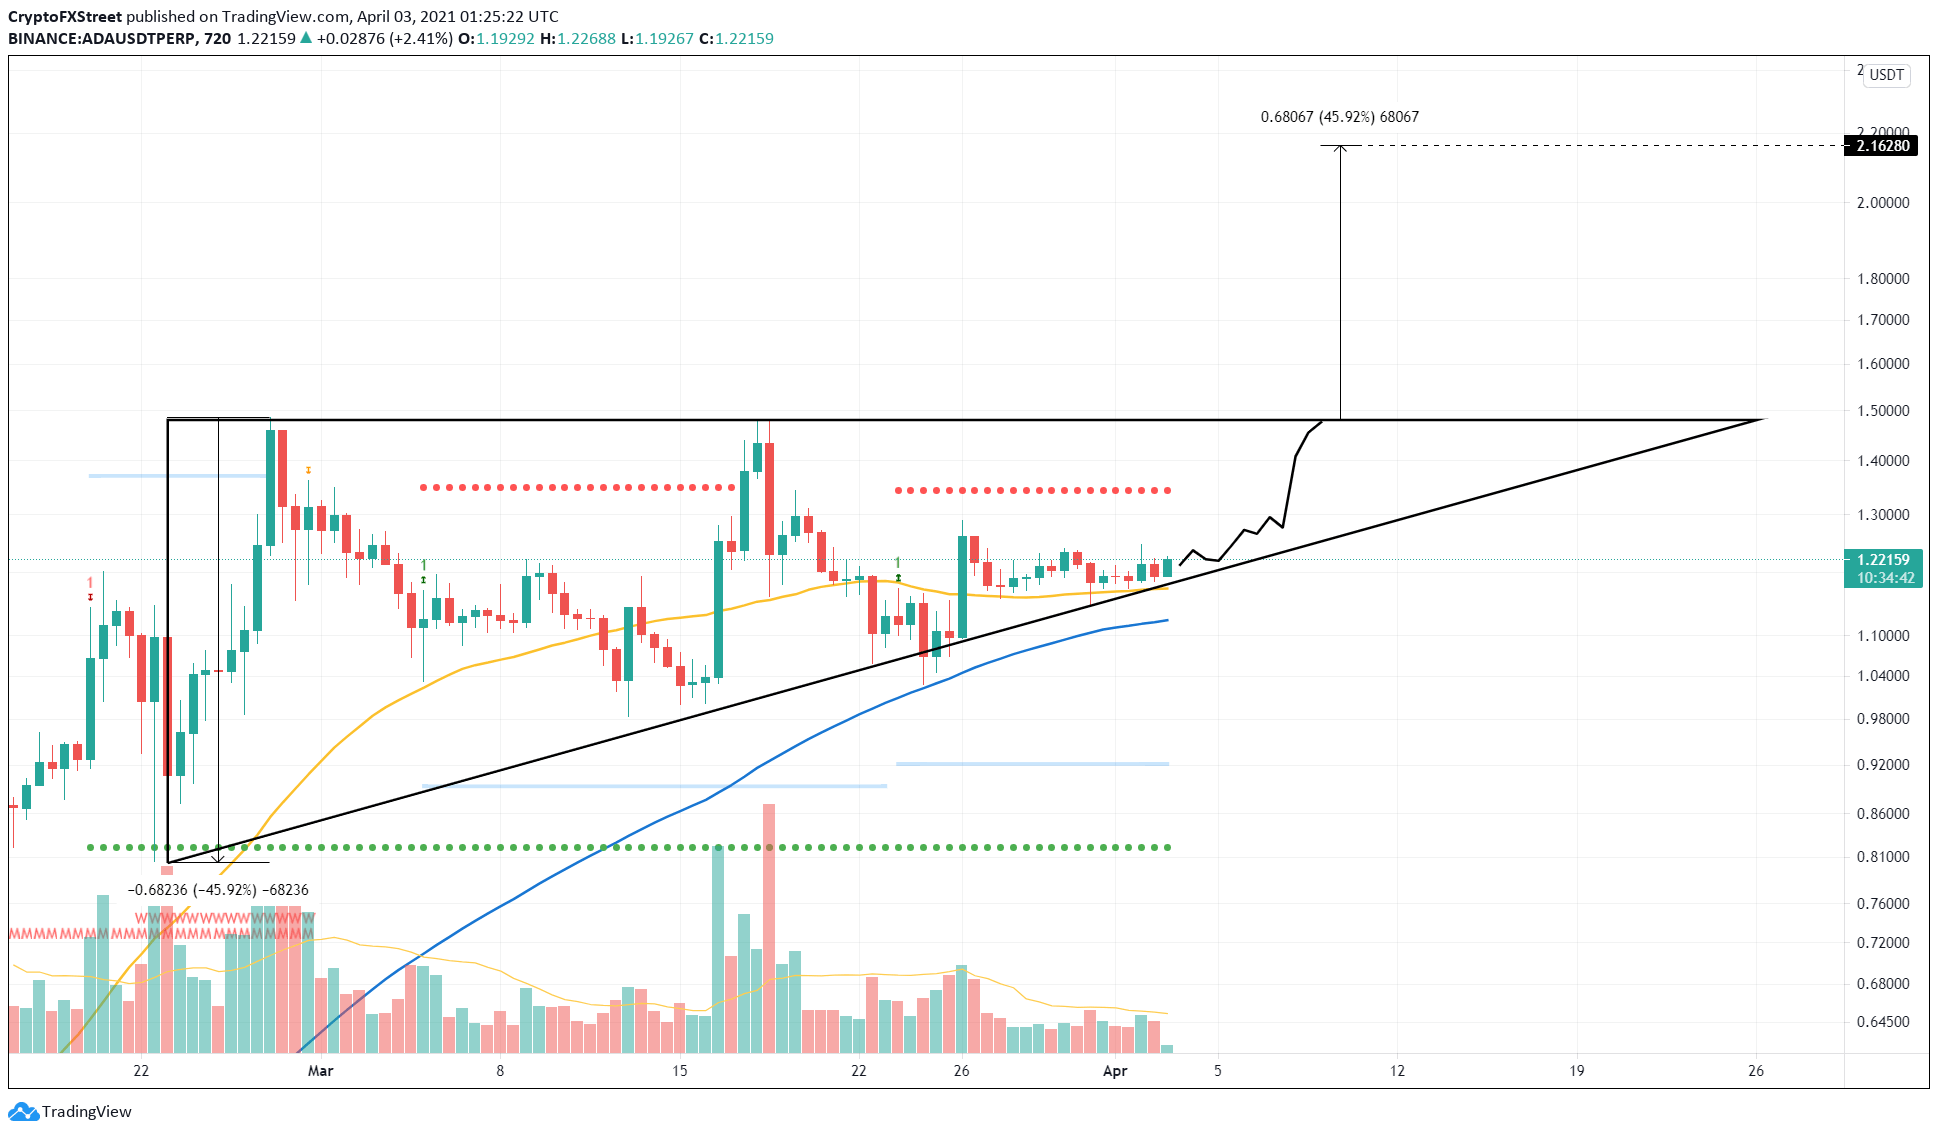
ADA/USDT 12-hour chart
Adding credence to this bullish outlook is the lack of resistance levels beyond $1.30, as shown by IntoTheBlock’s Global In/Out of the Money (GIOM) model.
Roughly 122,000 addresses that hold nearly 3 billion ADA purchased the token at an average price of $1.30. Therefore, clearing this zone will place these market participants “In the Money,” who might add to the bullish momentum if they decide to invest more.
Hence, it is necessary for the Cardano price to surge past this level to enter the price discovery phase.
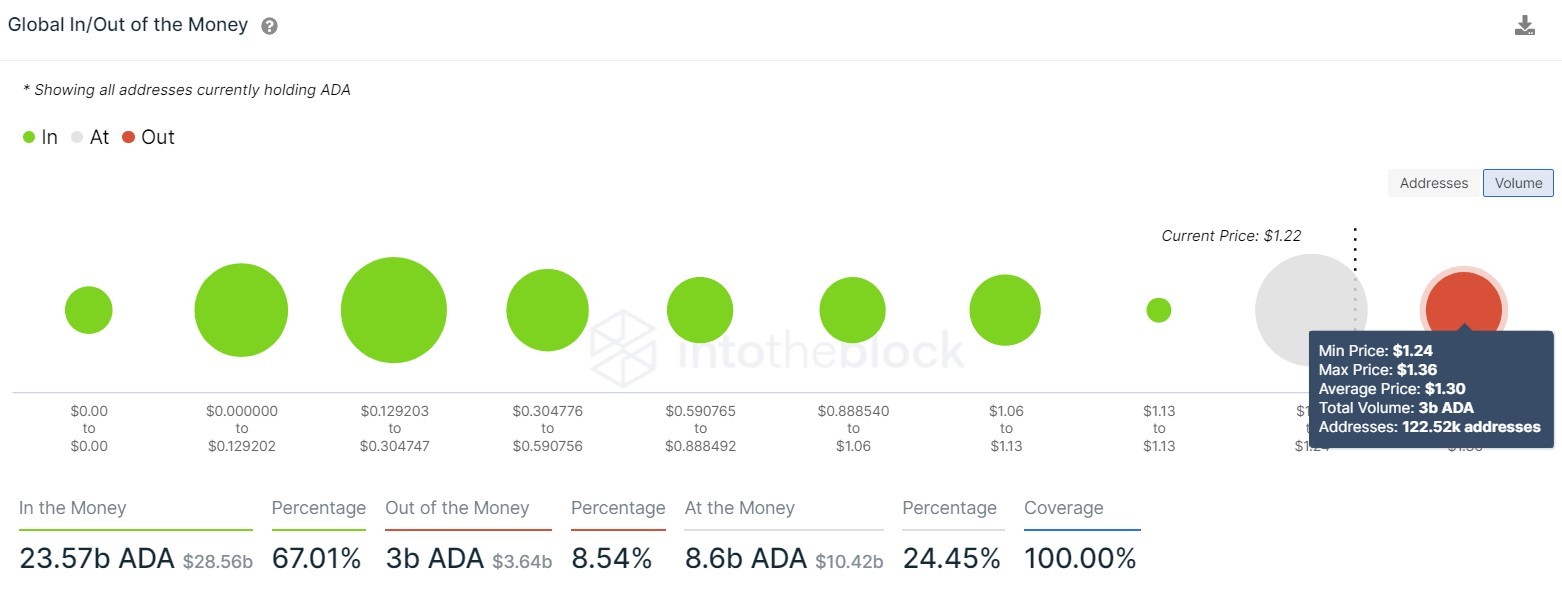
Cardano GIOM Chart
While the bullish narrative seems likely, investors should note that a failure to stay above the hypotenuse or rejection at $1.30, $1.35, or even at $1.48 could be fatal. In that case, the Cardano price could reverse its move.
A breakdown of the 50 and the 100 Simple Moving Averages (SMA) at $1.17 and $1.12, respectively, could signal the extinction of an upward move.
Furthermore, if bears manage to slice through the psychological level at $1, a full-blown reversal could be underway. This move could push the Cardano price to the immediate demand barrier at $0.92.
