- Cardano price has been under consolidation since January 7.
- The digital asset has formed a 12-hour symmetrical triangle pattern.
- A breakout or breakdown in the next week will most likely drive ADA price by 30%.
Cardano price hasn’t benefited much from the recent Bitcoin pump. The digital asset has been trading in a tightening range and it’s close to bursting. A clear breakout or breakdown can quickly push the digital asset by more than 30%.
Cardano price needs to crack this level to jump towards $0.50
On the 12-hour chart, the symmetrical triangle pattern has formed a resistance trendline at $0.37. A breakout above this point would drive Cardano price by 32% towards a high of $0.50.
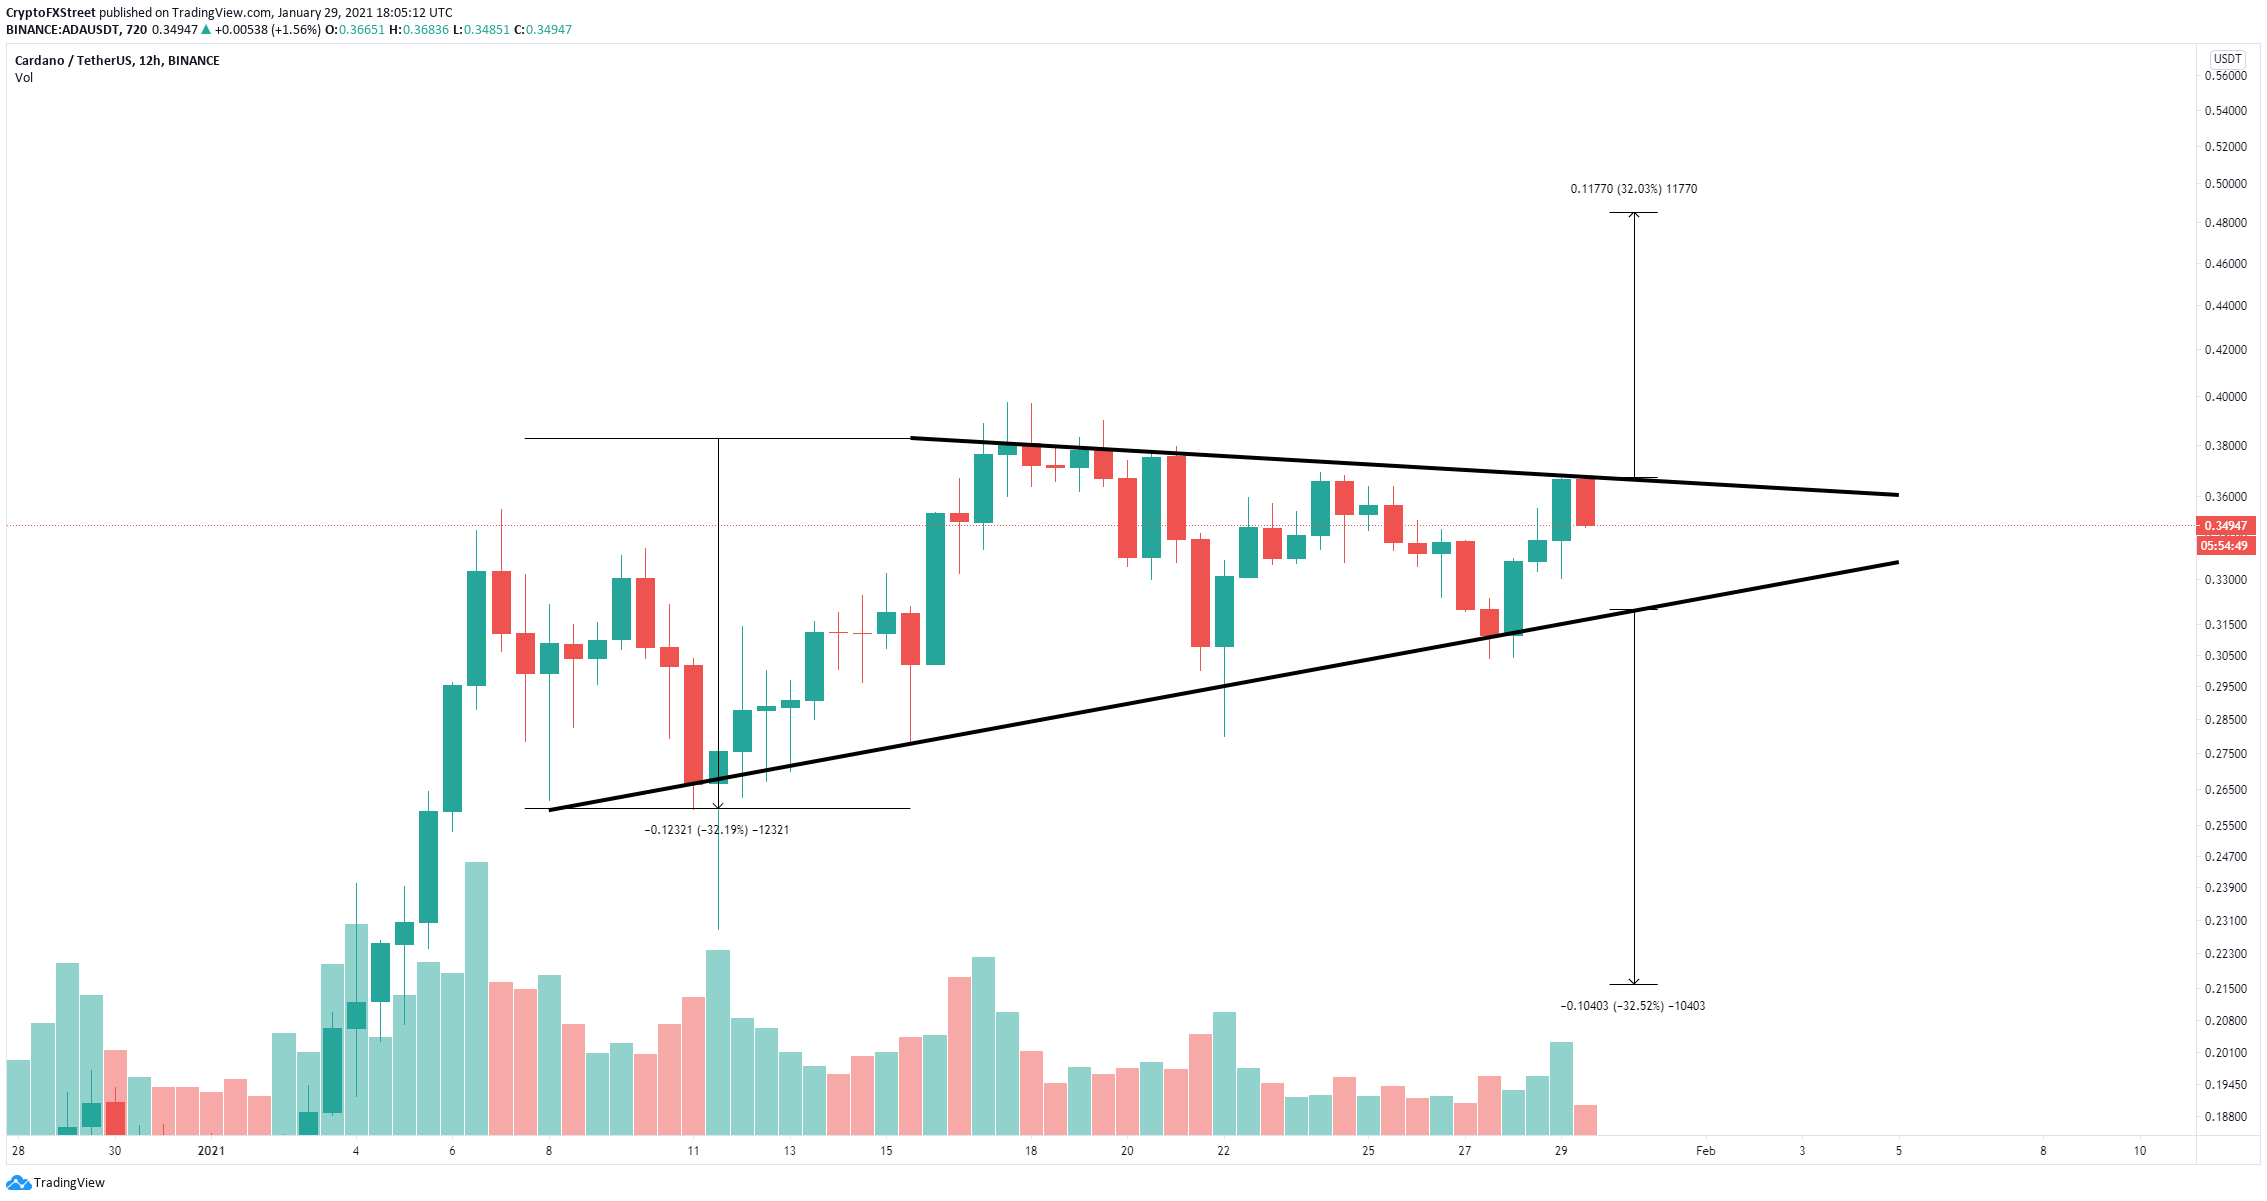
ADA/USD 12-hour chart
The In/Out of the Money Around Price (IOMAP) chart shows that the range between $0.35 and $0.36 is the strongest barrier with 2.2 billion ADA in volume. Climbing above this area will easily push Cardano above $0.40.
-637475405163454335.png)
ADA IOMAP chart
On the other hand, the support trendline at $0.32 must be defended at all costs by the bulls to avoid a massive dive towards $0.21. The IOMAP model suggests that the biggest support area is established between $0.308 and $0.319, coinciding with that support trendline.
