- LINK/USD has crossed above the 20-day Bollinger Band.
- The RSI is trending around 84.375 in the RSI indicator.
LINK/USD daily chart
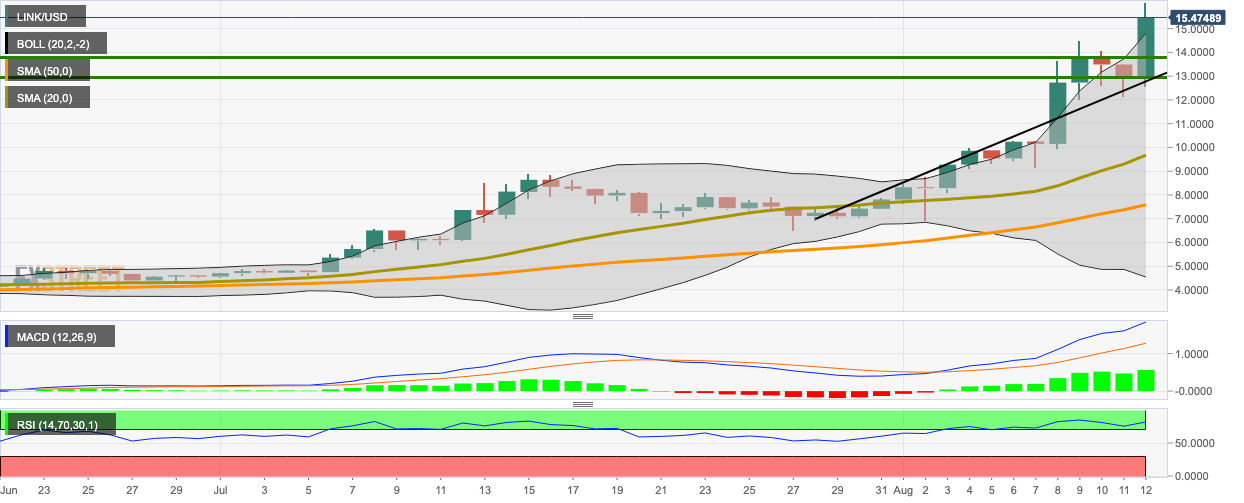
LINK/USD bulls came roaring back following two straight bearish days. The price has jumped up from $13 to $15.45. The MACD shows increasing bullish market momentum. The price has four healthy support levels at $13.81, $13, $9.70 (SMA 20) and $7.60 (SMA 50).
The price is hovering above the 20-day Bollinger Band and the relative strength index (RSI) is trending around 84.375. Both these indicators show that the asset is presently overvalued, and may face bearish correction soon.
