- Chainlink price trades at $12.12 at the time of writing waiting for a clear direction.
- Several buy and sell signals have been presented across numerous time frames.
It seems that Chainlink price is bound for a short-term bounce but at the same time faces strong selling pressure. The digital asset has been trading inside a robust daily uptrend and an ascending parallel channel.
Chainlink price on the verge of a breakdown but also showing bullish signs
On the daily chart, Chainlink seems to be on the cusp of a potential breakdown below the support trendline of the ascending parallel channel pattern. Odds seem to favor the bears as the TD Sequential indicator has just presented a sell signal on the weekly chart.
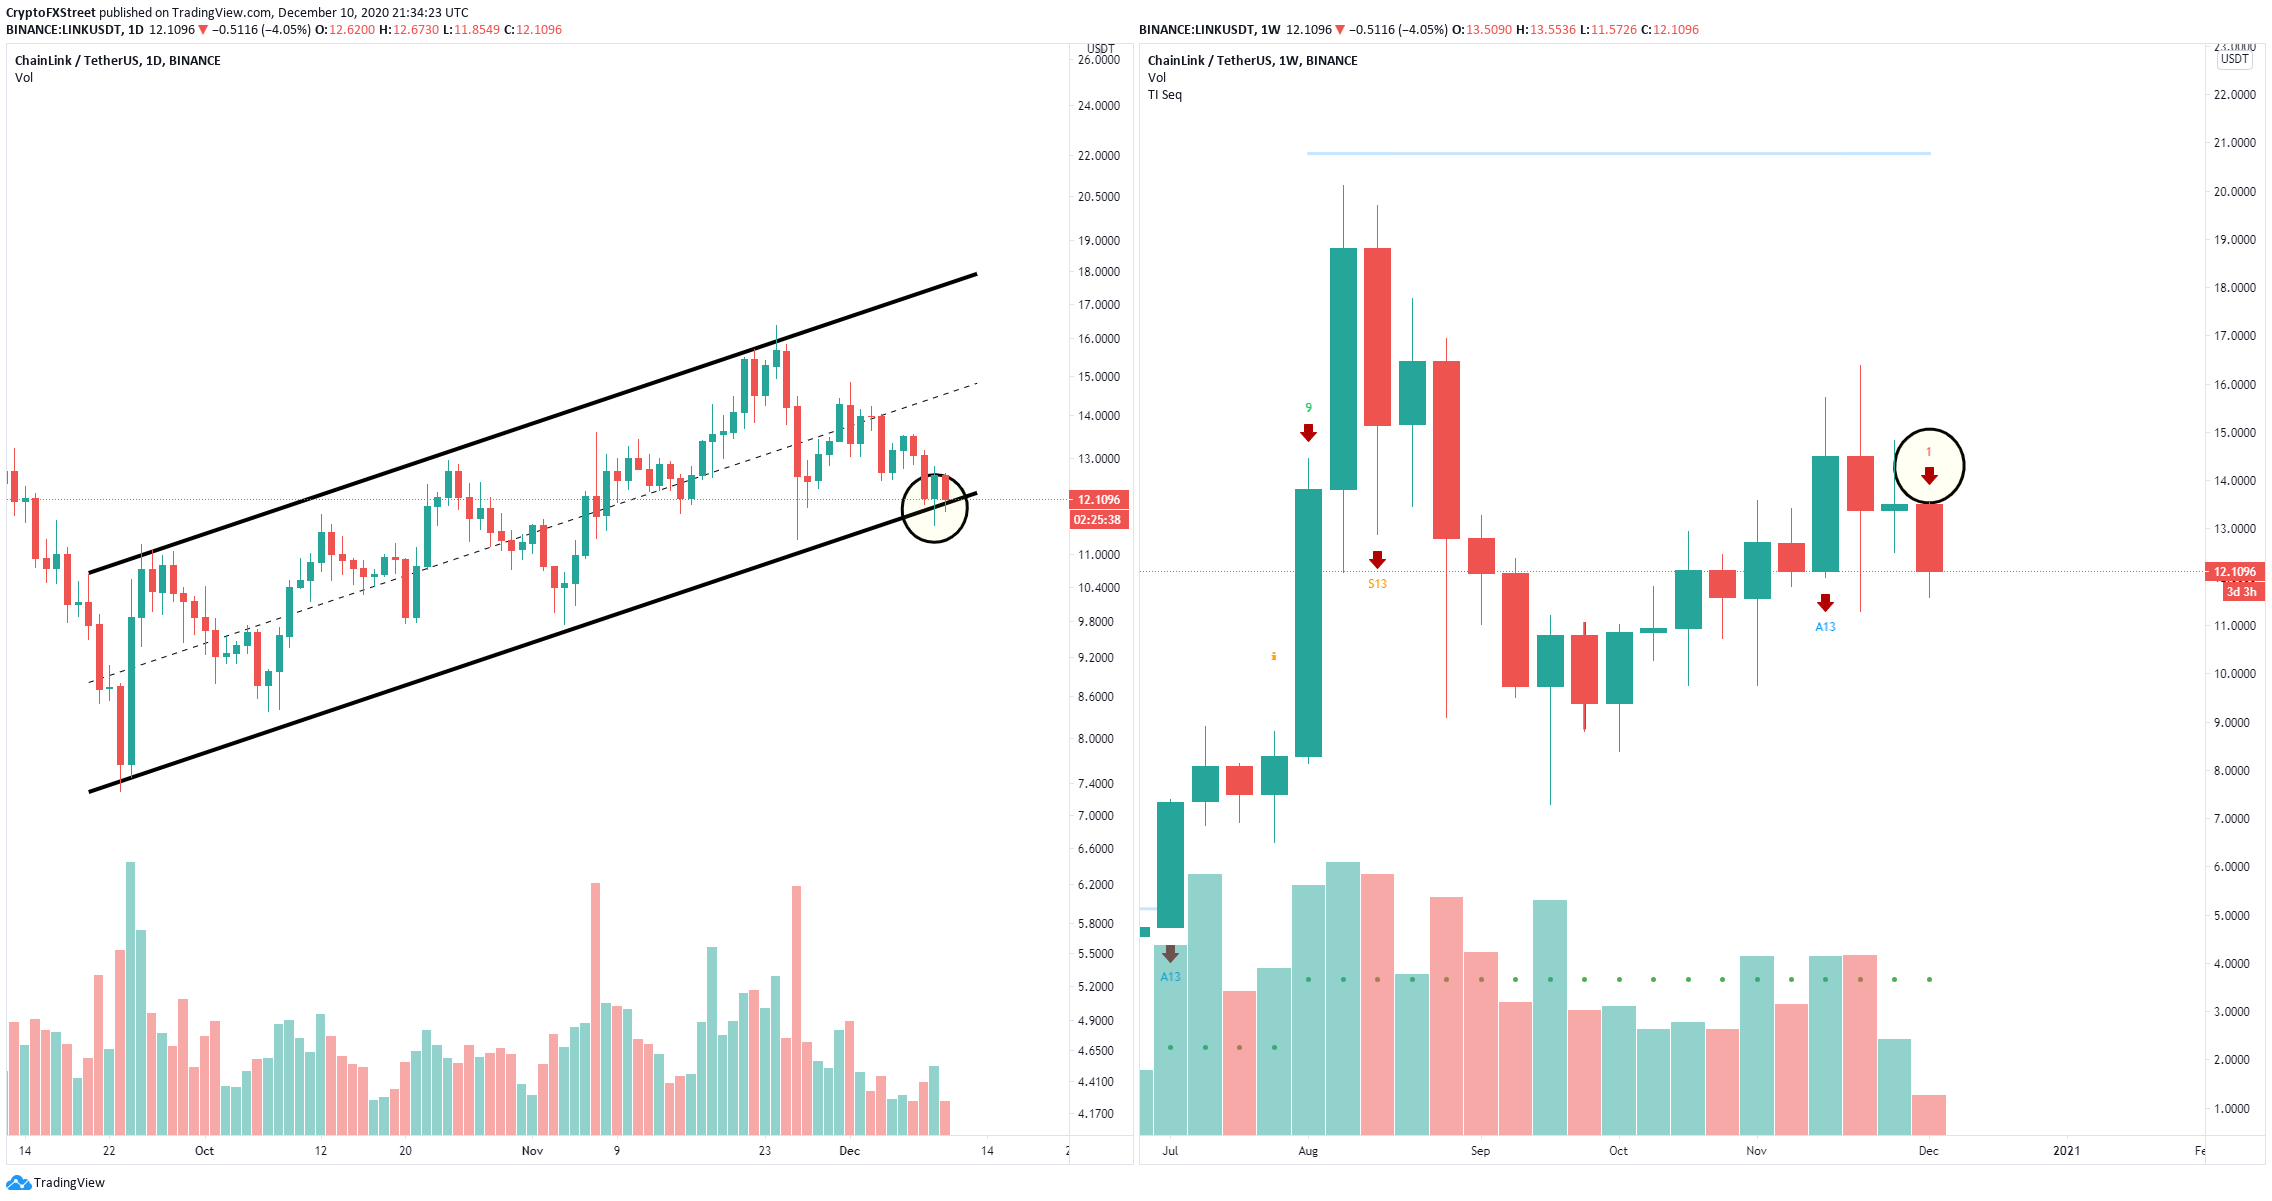
LINK/USD daily and weekly charts
Additionally, the In/Out of the Money Around Price (IOMAP) shows only one significant support area between $11.73 and $12.09 which coincides with the lower trendline of the ascending parallel channel. A breakdown below this range can quickly push Chainlink price towards $10.
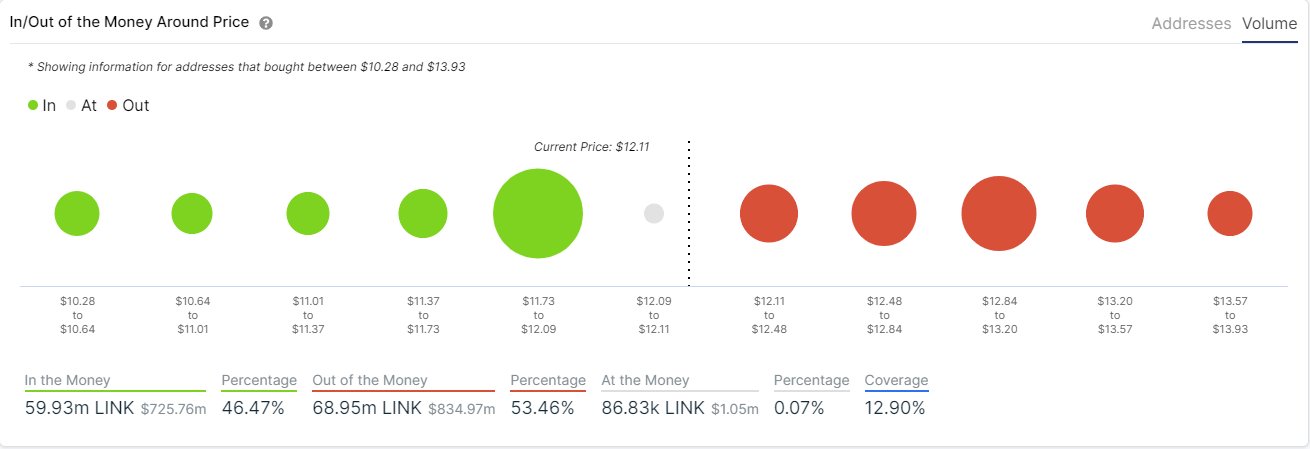
LINK IOMAP chart
On the other hand, on the 12-hour chart, Chainlink has defended a critical support level at $12.09 which also coincides with the lower support trendline of the ascending parallel channel on the daily chart.
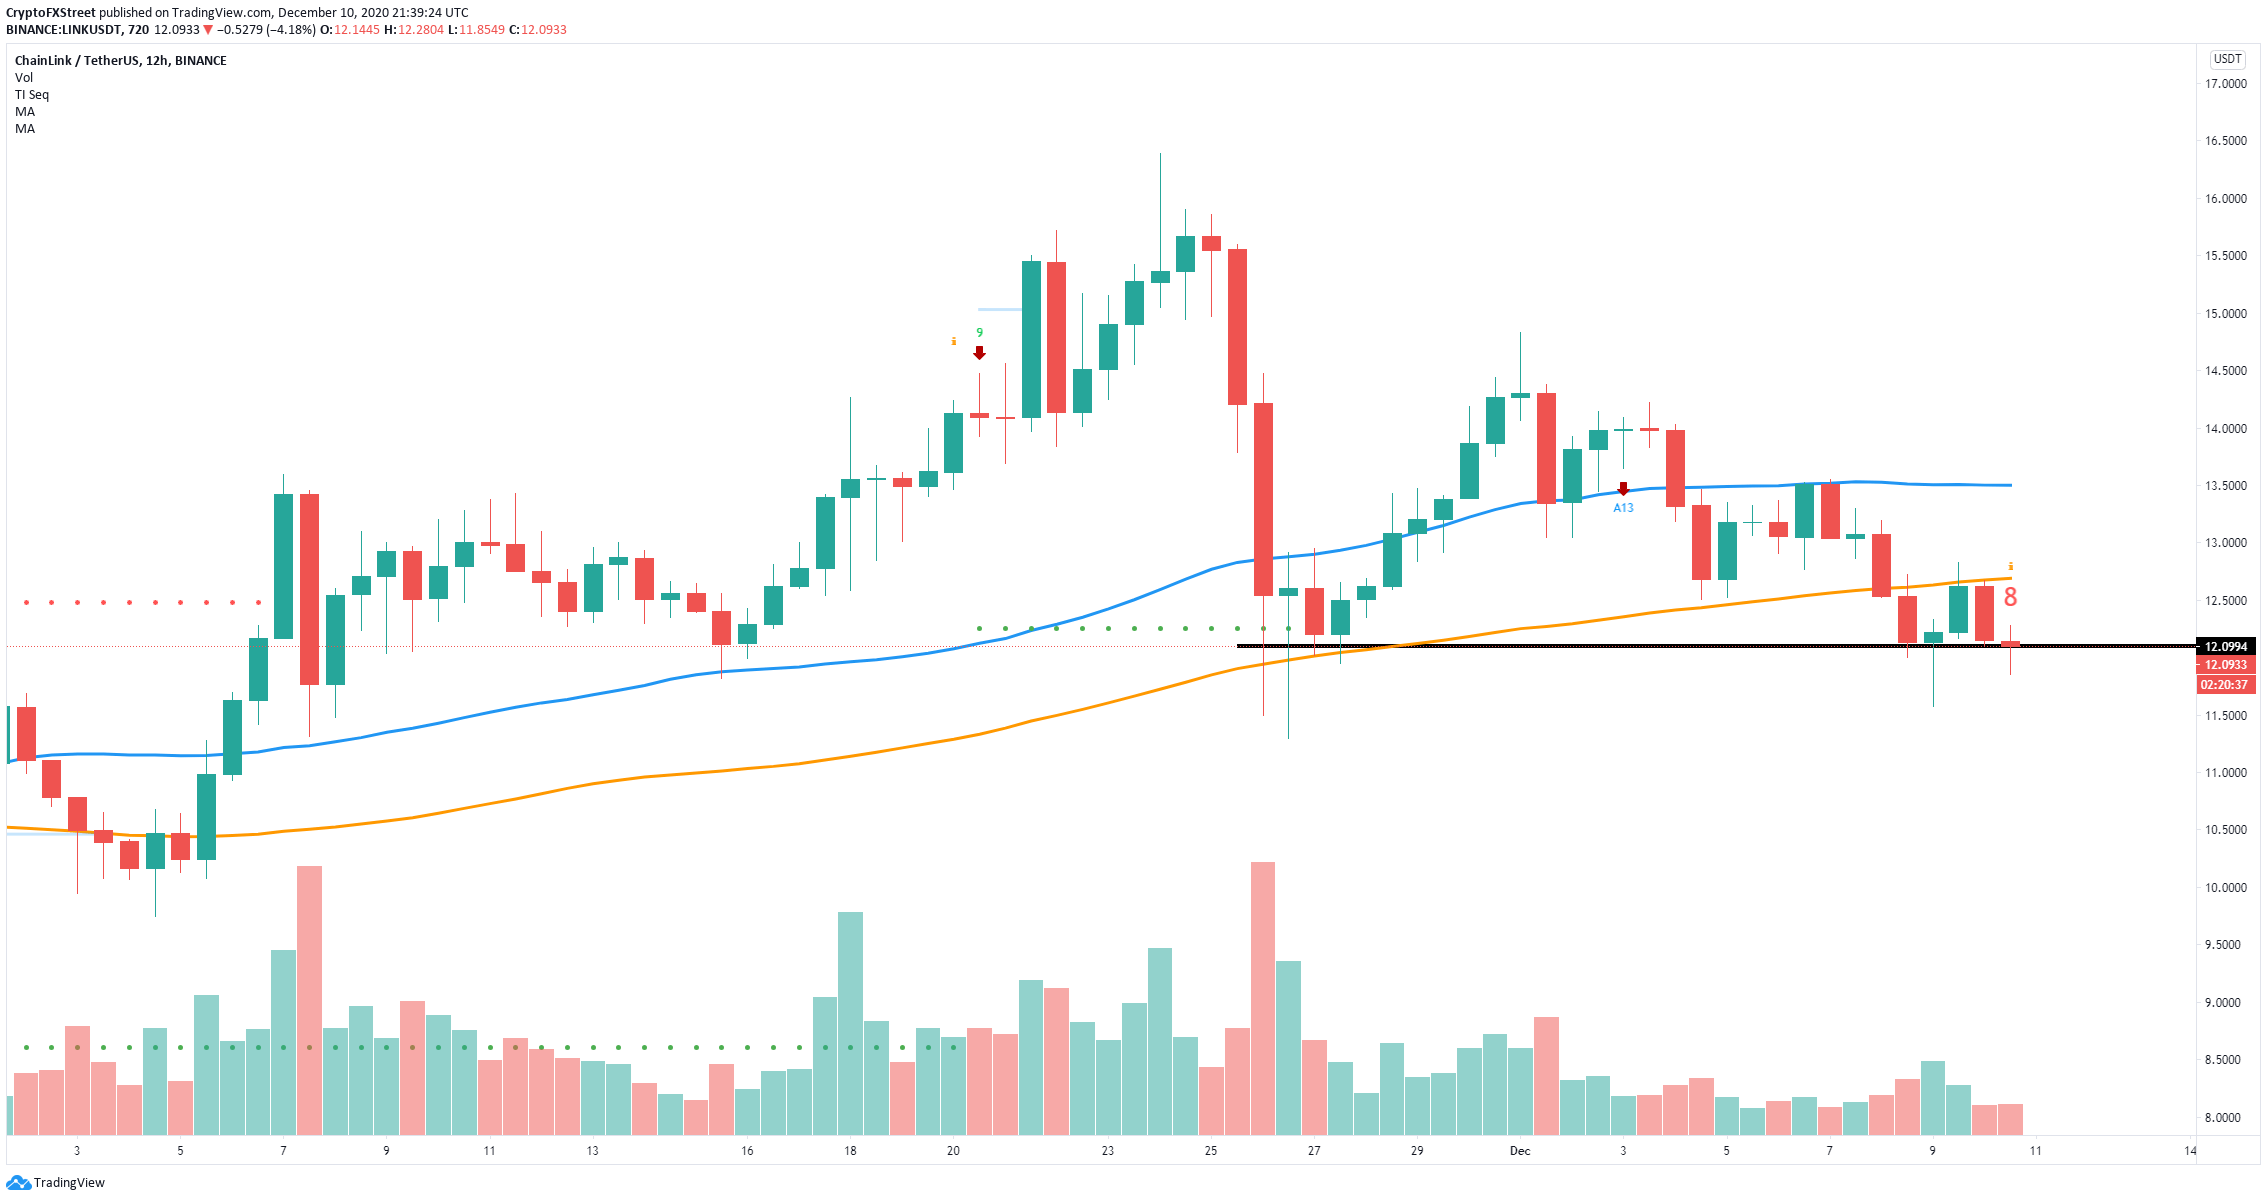
LINK/USD 12-hour chart
It also seems that the TD Sequential indicator is hours away from presenting a buy signal. Successfully defending the critical support level and climbing above the 50-SMA at $12.7 would lead Chainlink towards the 100-SMA at $13.5
