- Chainlink is currently trading at $9 after a strong rebound from a descending parallel channel on the hourly chart.
- Several indicators are shifting in favor of the bulls in the short-term.
Chainlink failed to stay above $10 after bouncing strongly from its low at $7.8 on September 23. The digital asset is now fighting for the $9 level trying to rebound again.
LINK/USD 1-hour chart
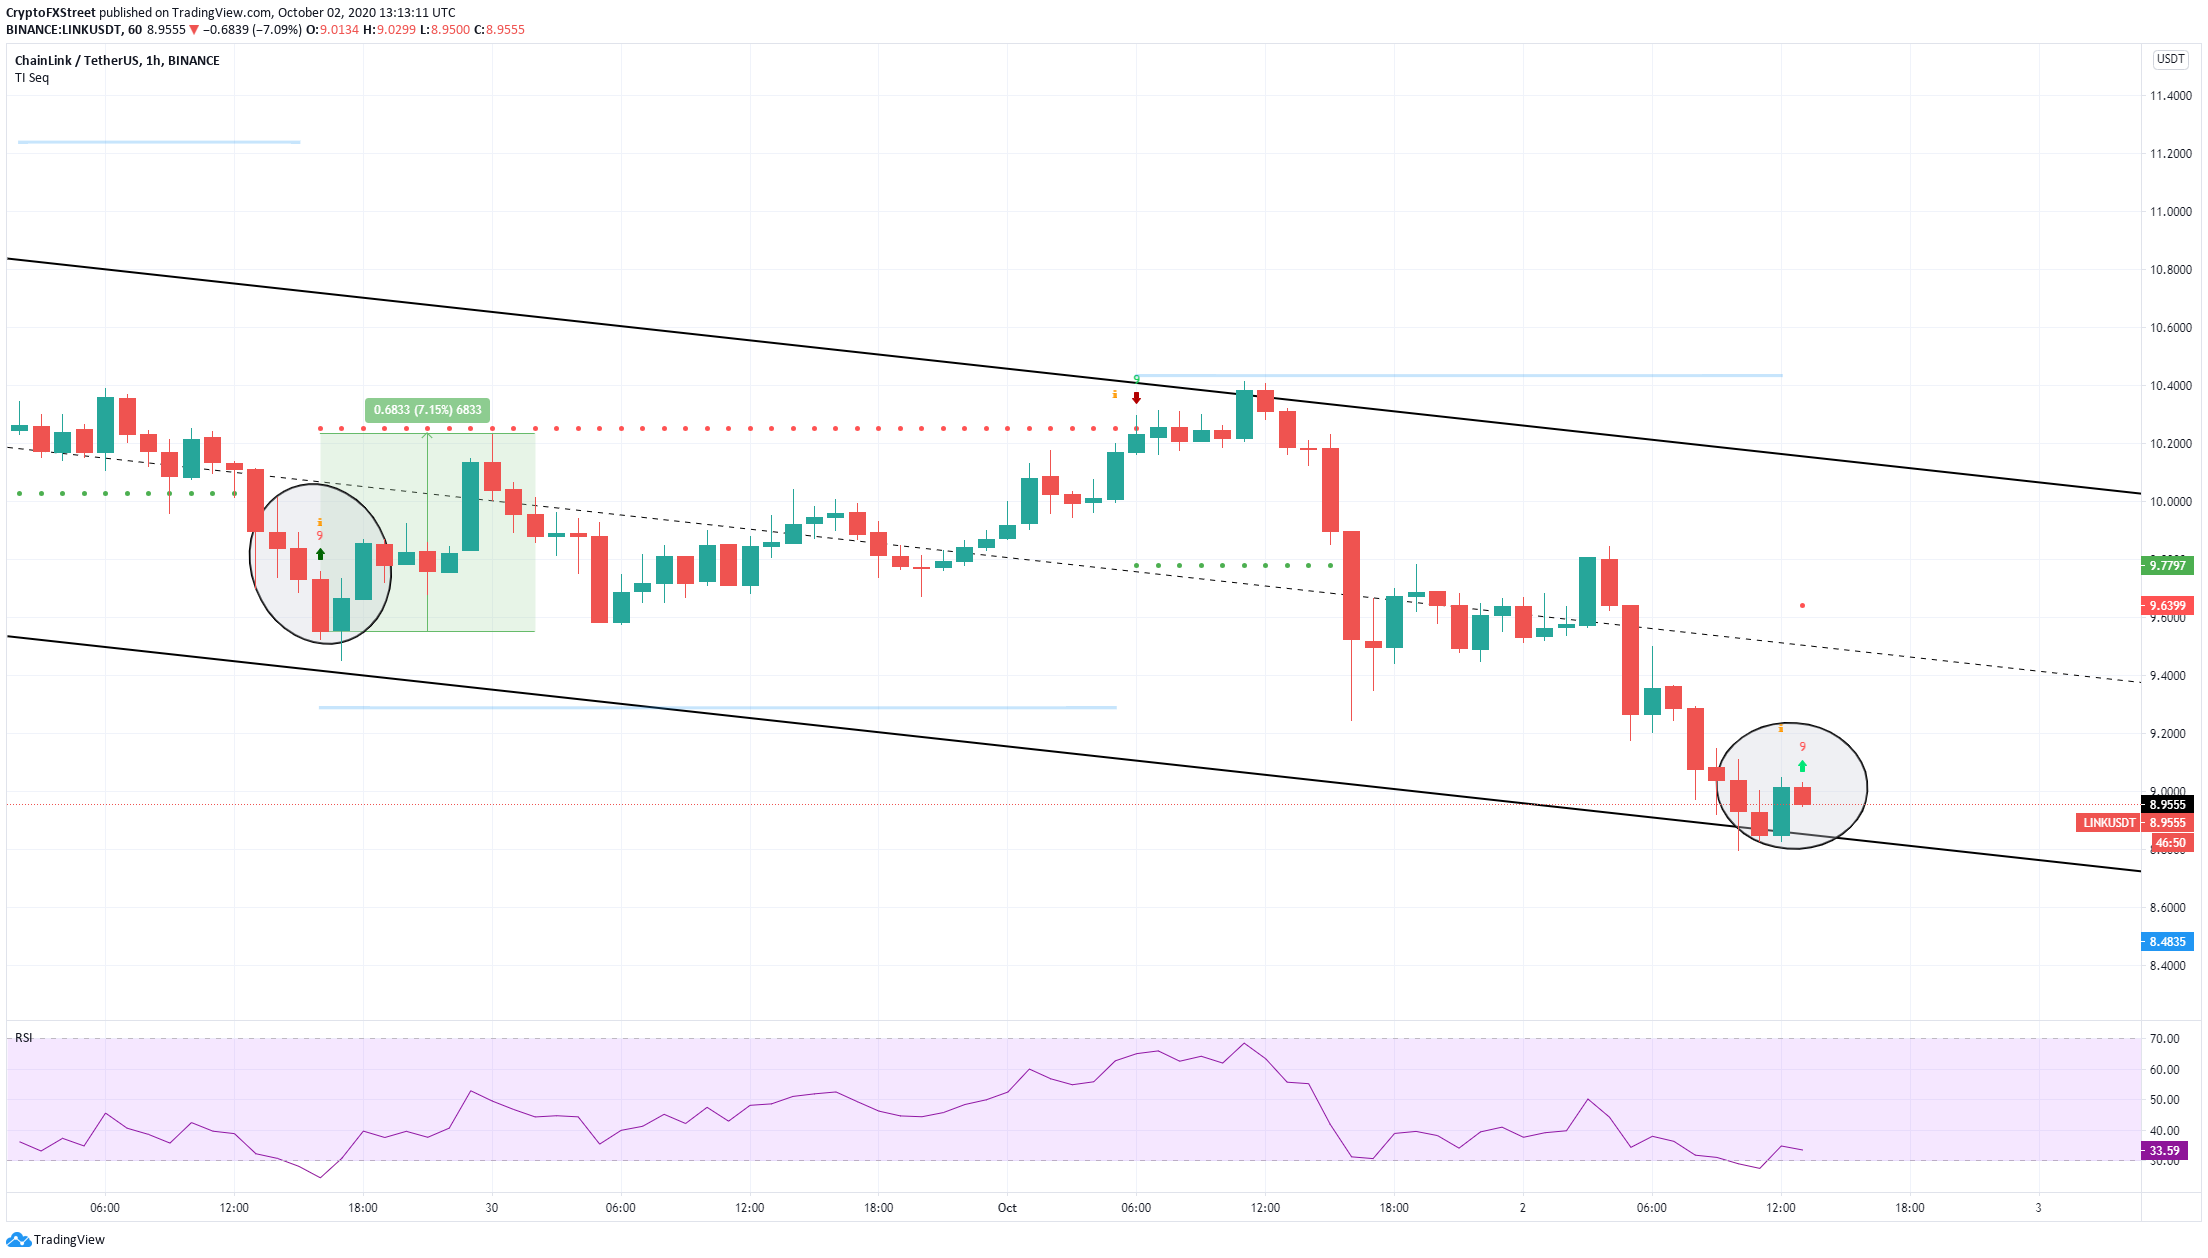
The most important short-term pattern was formed on the 1-hour chart. The lower trendline of the descending parallel channel is acting as a strong support level. The RSI was overextended and also added further buying pressure.
Additionally, the TD sequential indicator has presented a buy signal after an initial 2% bounce. The last signal was created on September 29 and had a 7% price followthrough.
LINK IOMAP Chart
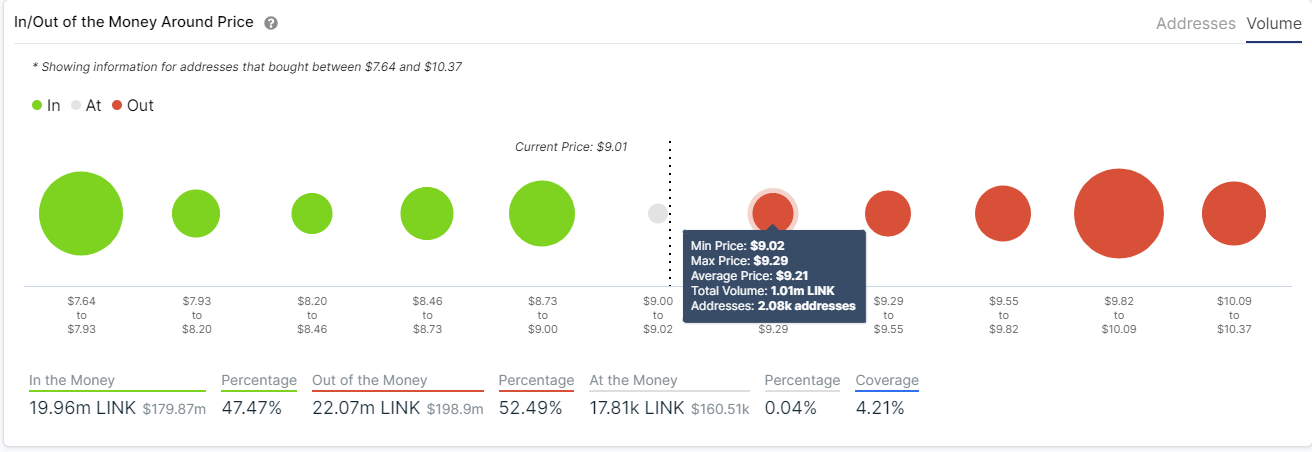
Looking at the In/Out of the Money Around Price chart by IntoTheBlock, we can observe that LINK is not facing a lot of resistance well until $9.8. The range between $9.8 and $10 is the strongest because 11.7 million LINK were bought there as opposed to only 5.6 million coins from $9 to $9.8. A validation of the buy signal will take the price up to $9.8 in the short-term.
LINK/USD 45-minutes chart
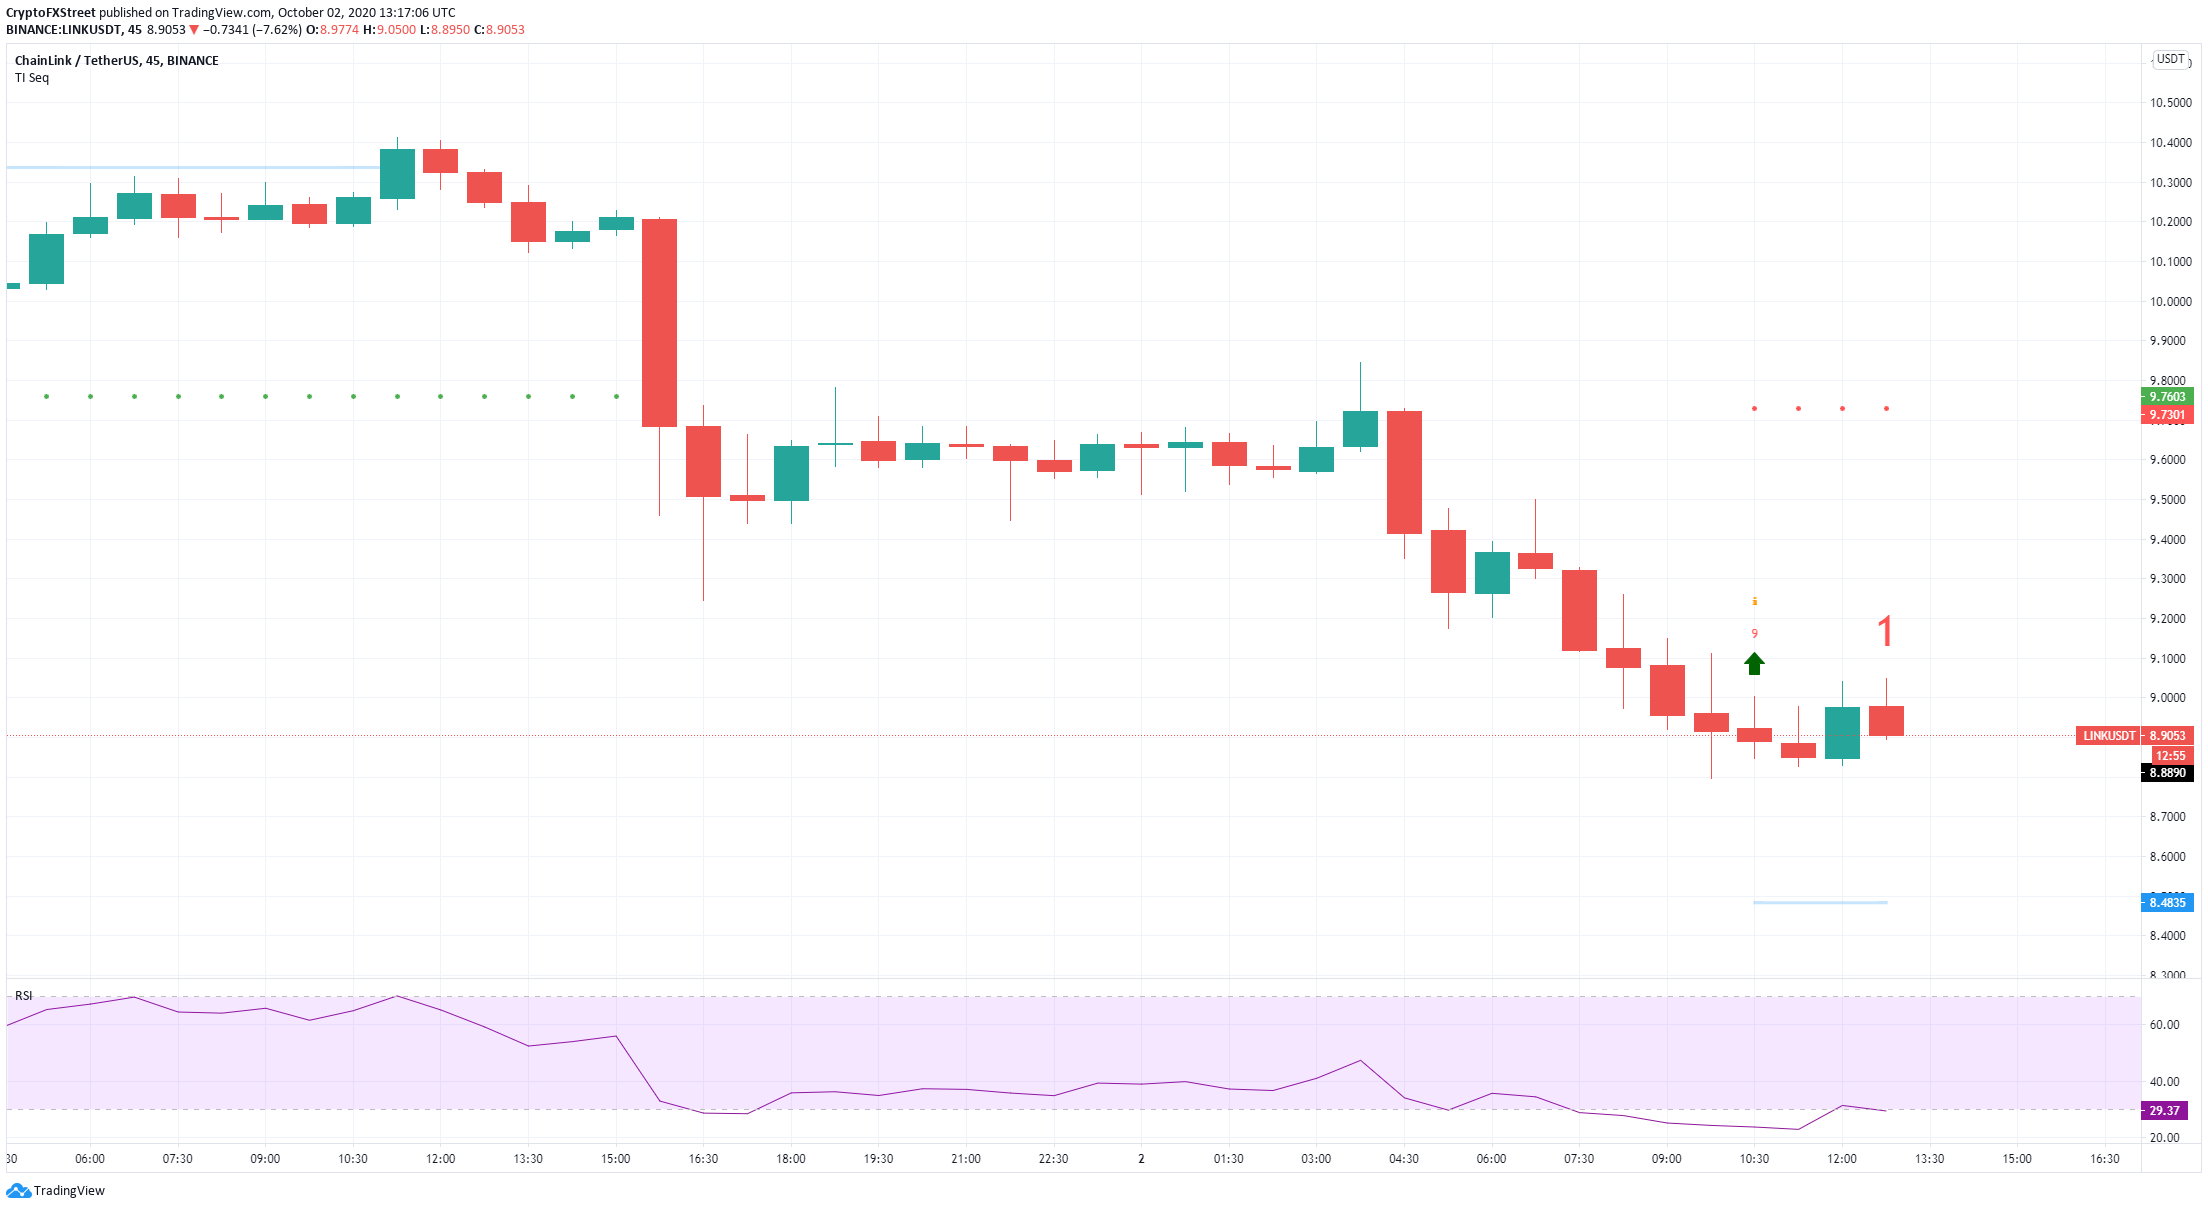
Similarly, the TD sequential indicator presented another buy signal on the 45-minute chart which seems to be getting followthrough.
LINK IOMAP Chart
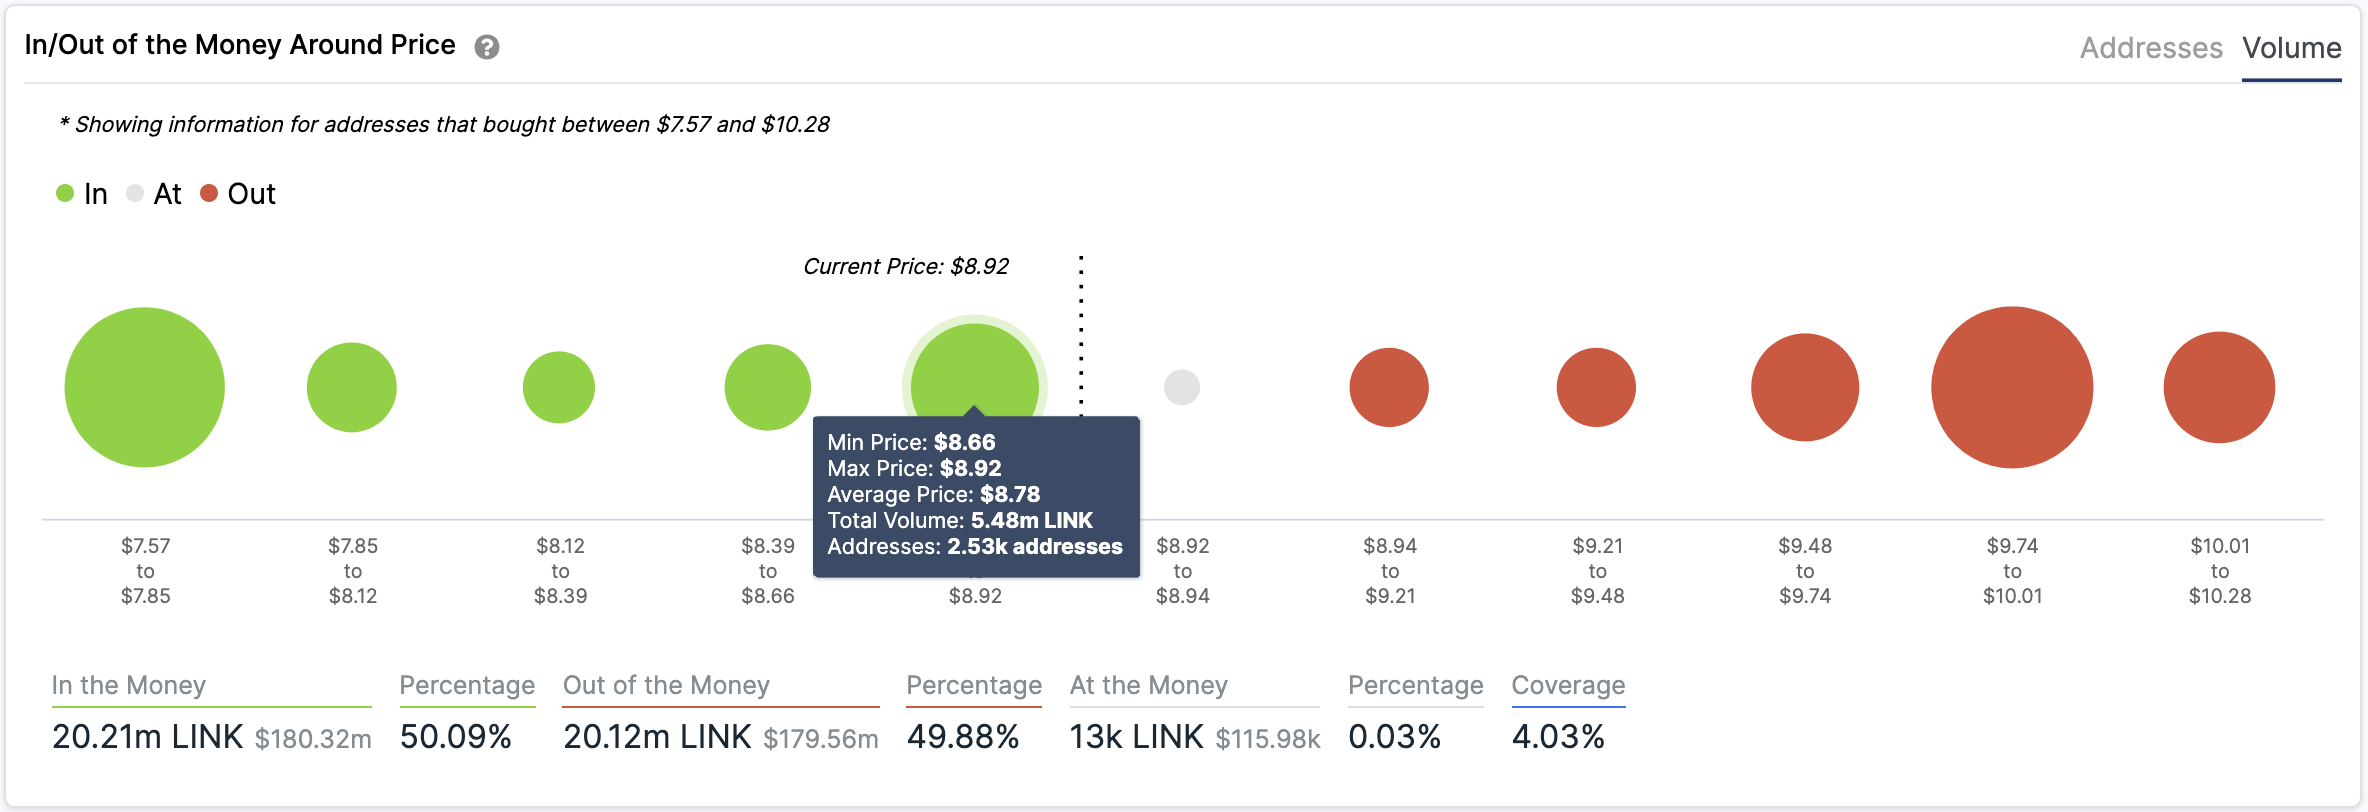
However, if we take a look at the IOMAP chart again, we can also see that the most important support area is between $8.6 and $8.9, where 5 million LINK coins were bought and coincides with the lower boundary of the descending parallel channel on the 1-hour chart.
If there is a bearish breakout below $8.8, we could see the downtrend continue and push LINK towards $7.7
