- Chainlink price broke out of a descending parallel channel and must defend a crucial support level.
- If bulls can hold the critical level at $13, Chainlink price can quickly climb towards $17.
Chainlink was trading inside a long-term descending parallel channel on the 4-hour chart. On January 3, LINK broke out of the pattern and saw a lot of continuation towards $15. Now, Chainlink is re-testing the upper resistance trendline of the previous pattern.
Chainlink price needs to hold $13, but not everything is in its favor
After a breakout of a parallel channel, it’s quite common for the asset to drop back down and retest the previous resistance level. If this level is held, the digital asset will go on to climb to the bullish price target, in this case, $17.
-637453828459410921.png)
LINK/USD 4-hour chart
The In/Out of the Money Around Price (IOMAP) chart shows very little resistance to the upside compared to the support below. The most significant support area is located between $12.6 and $13 which coincides with the theory above.
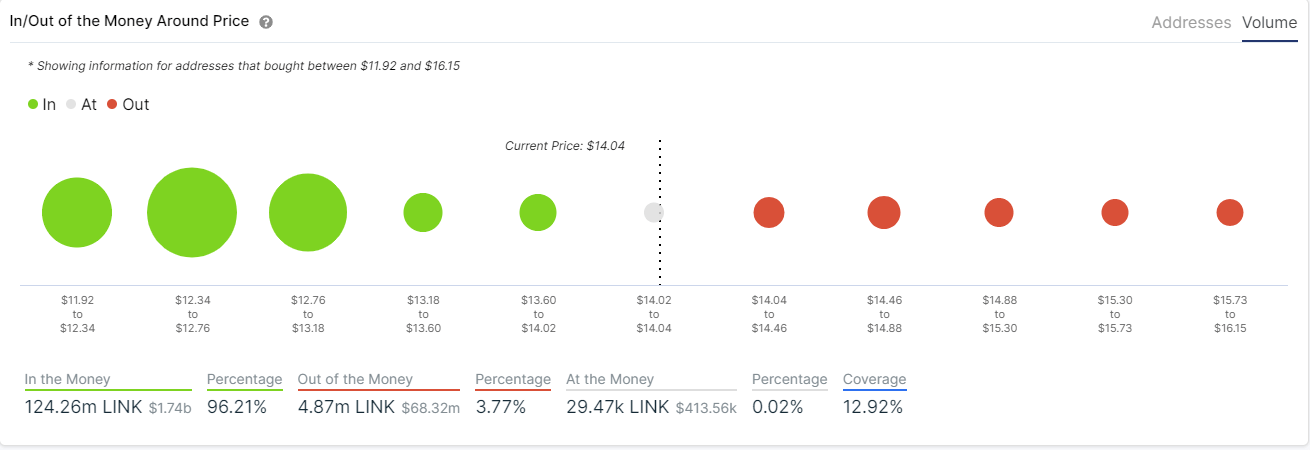
LINK IOMAP chart
As long as bulls can hold this area, Chainlink price can quickly climb above $16 targeting $17. However, the TD Sequential indicator is on the verge of presenting a sell signal on the 12-hour chart, within the next five hours. Confirmation of this call can push LINK towards the support level at $13 again, adding selling pressure.
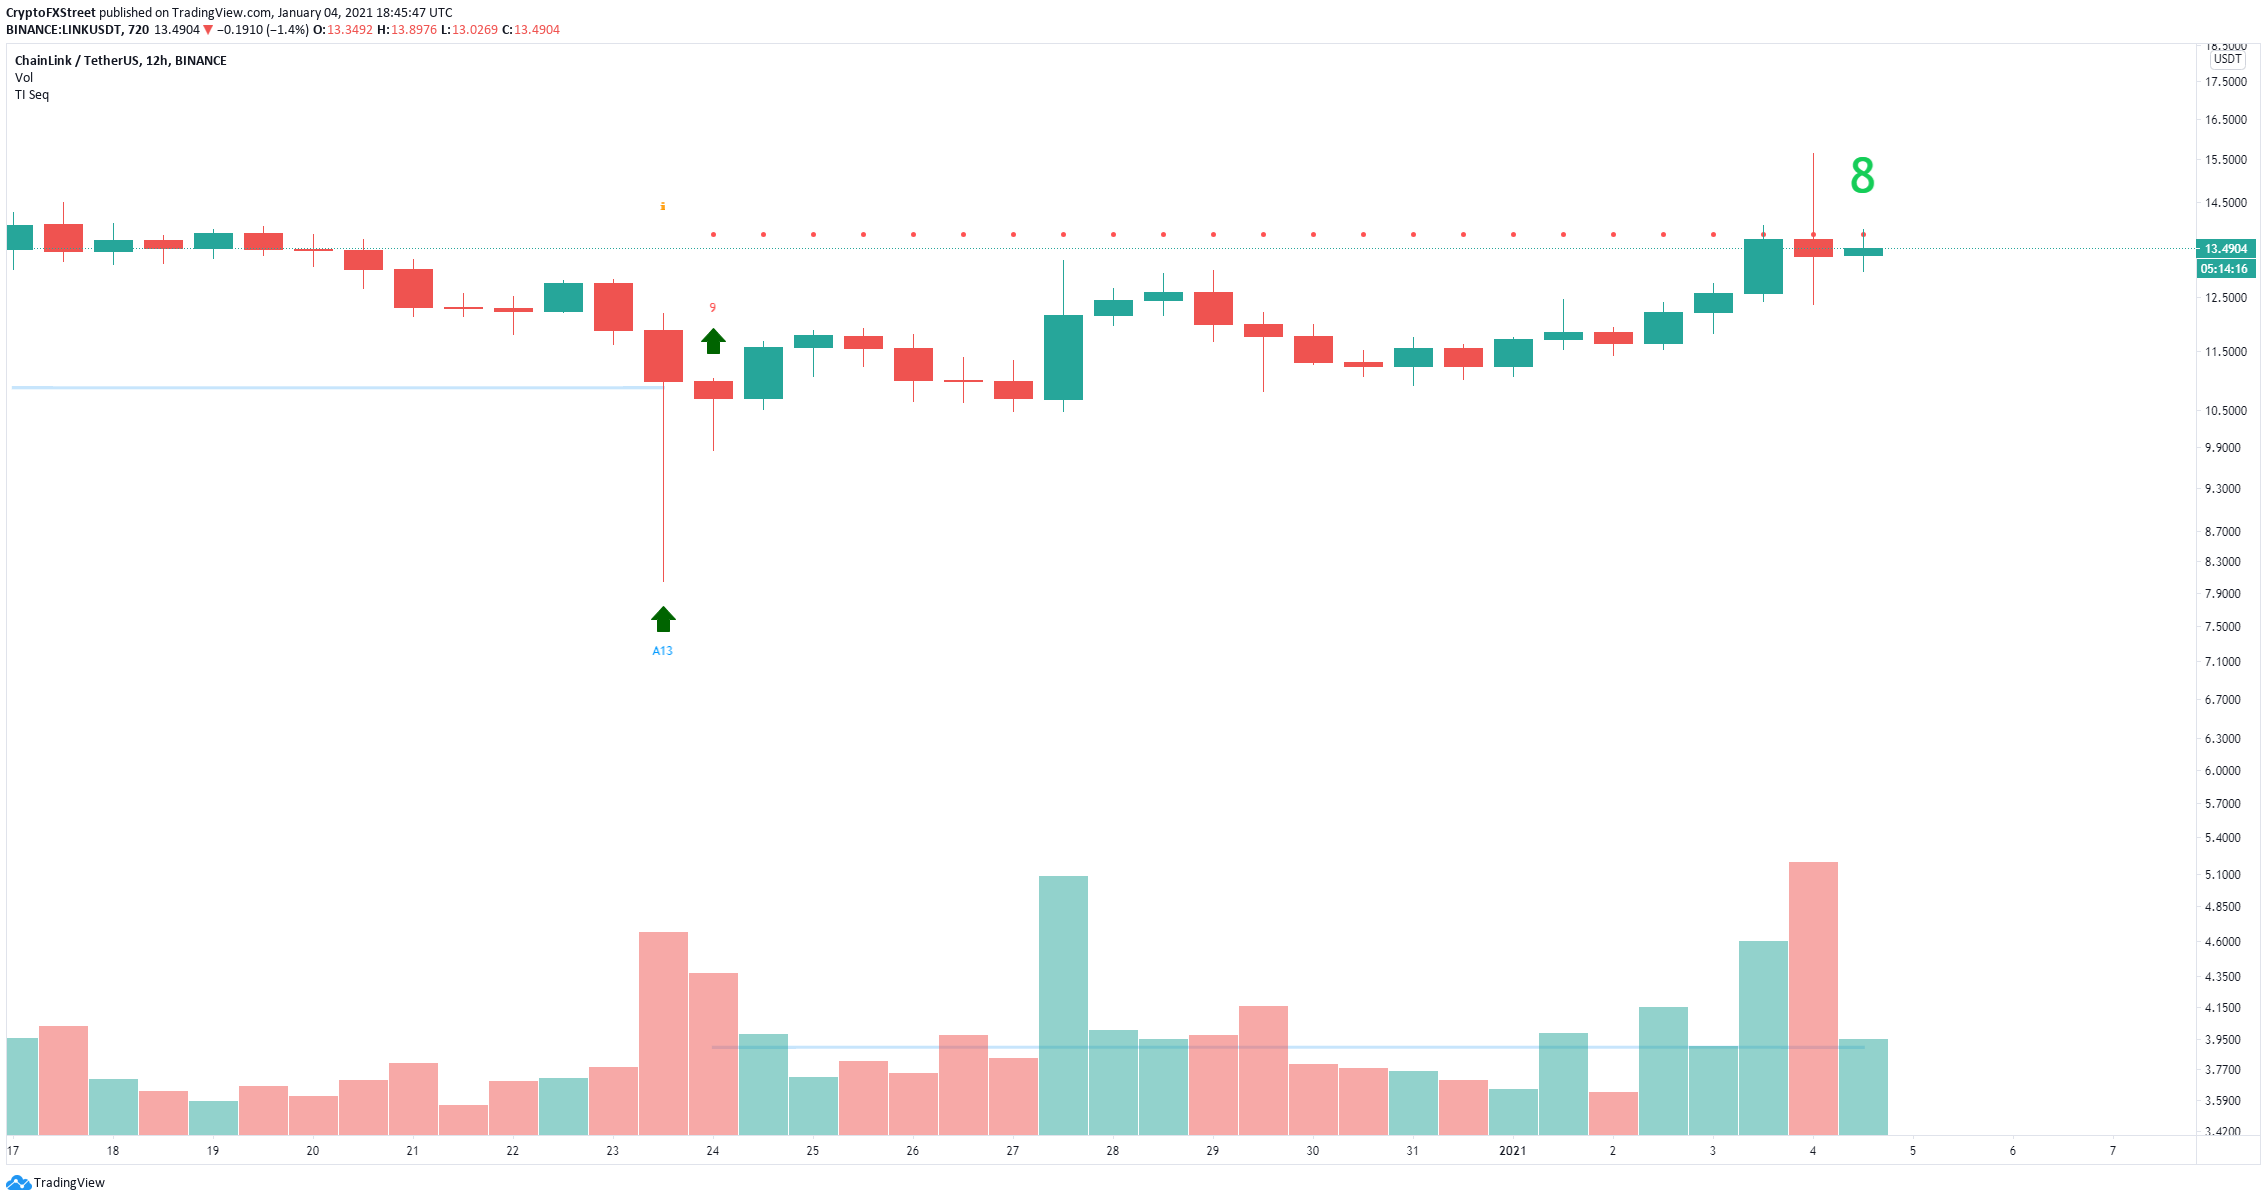
LINK/USD 12-hour chart
The next potential price target if $13 is decisively lost would be $11. Additionally, this breakdown would significantly shift the odds in favor of the bears in the longer-term.
