- LINK is currently trading at $9.62 after a firm rejection from the $10 resistance level.
- ChainLink had a massive 42% pump from September 23 to September 24.
On September 25, around 12 hours ago, LINK formed a relatively bullish hammer candlestick on the 12-hour chart that got no continuation. The digital asset seems to be developing a Doji candlestick, which represents uncertainty from investors.
LINK/USD 12-hour chart
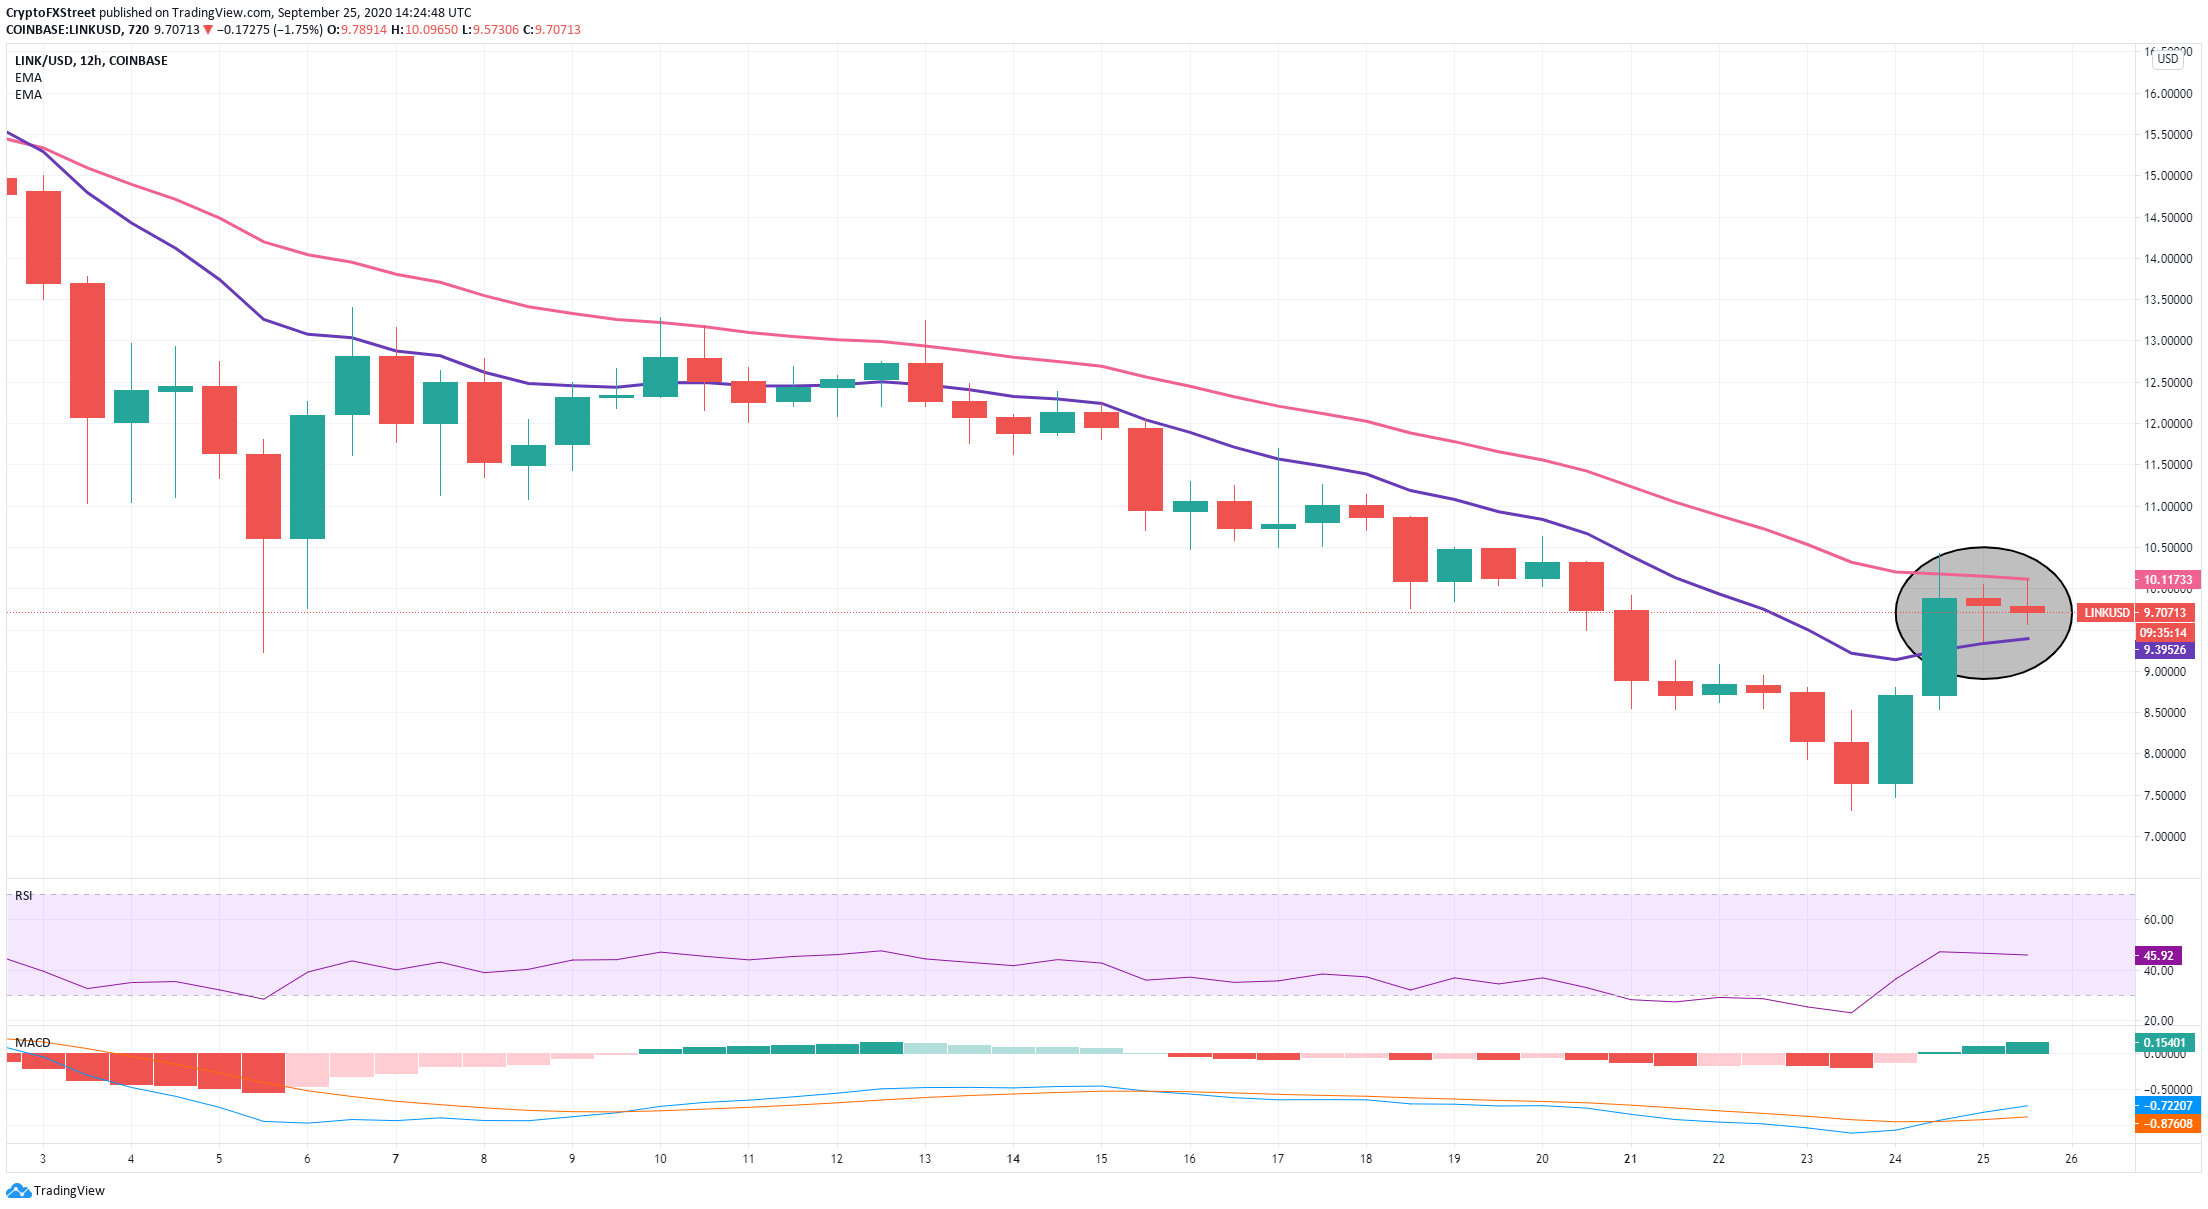
LINK price managed to climb above the 12-EMA but got rejected several times from the 26-EMA. After a bullish move, the digital asset seems to have turned the 12-EMA into support but still needs to climb above $10, which coincides with the current position of the 26-EMA.
LINK IOMAP Chart
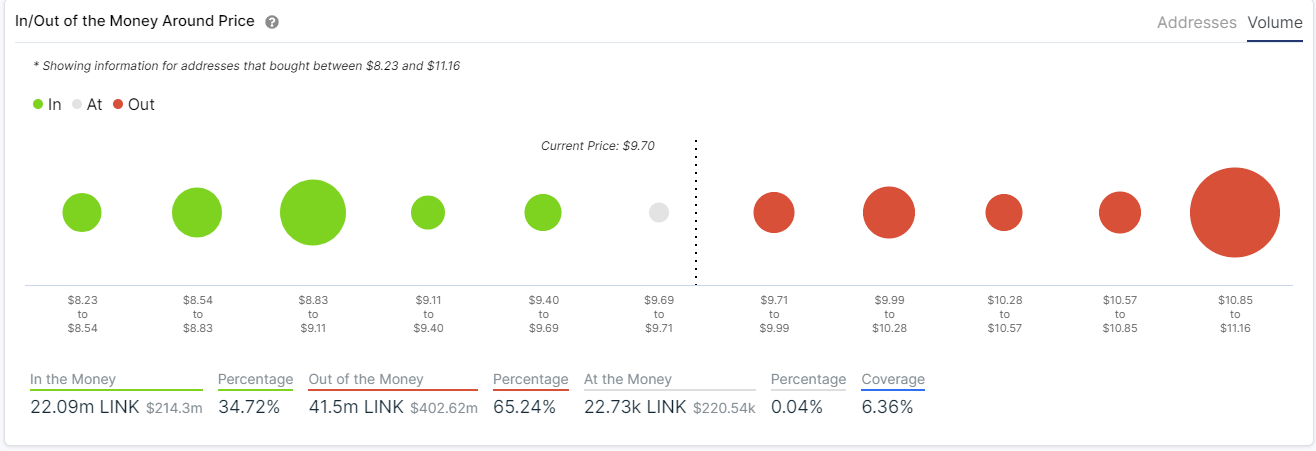
The MACD turned bullish more than 24 hours ago when bulls were eying up $10. According to the In/Out of the Money Around Price chart from IntoTheBlock, the biggest resistance level is actually established at $11, where more than 4,200 addresses bought close to 29 million LINK coins. Comparatively, only 1.6 million coins were bought a the support level of $9.56.
LINK/USD 4-hour chart
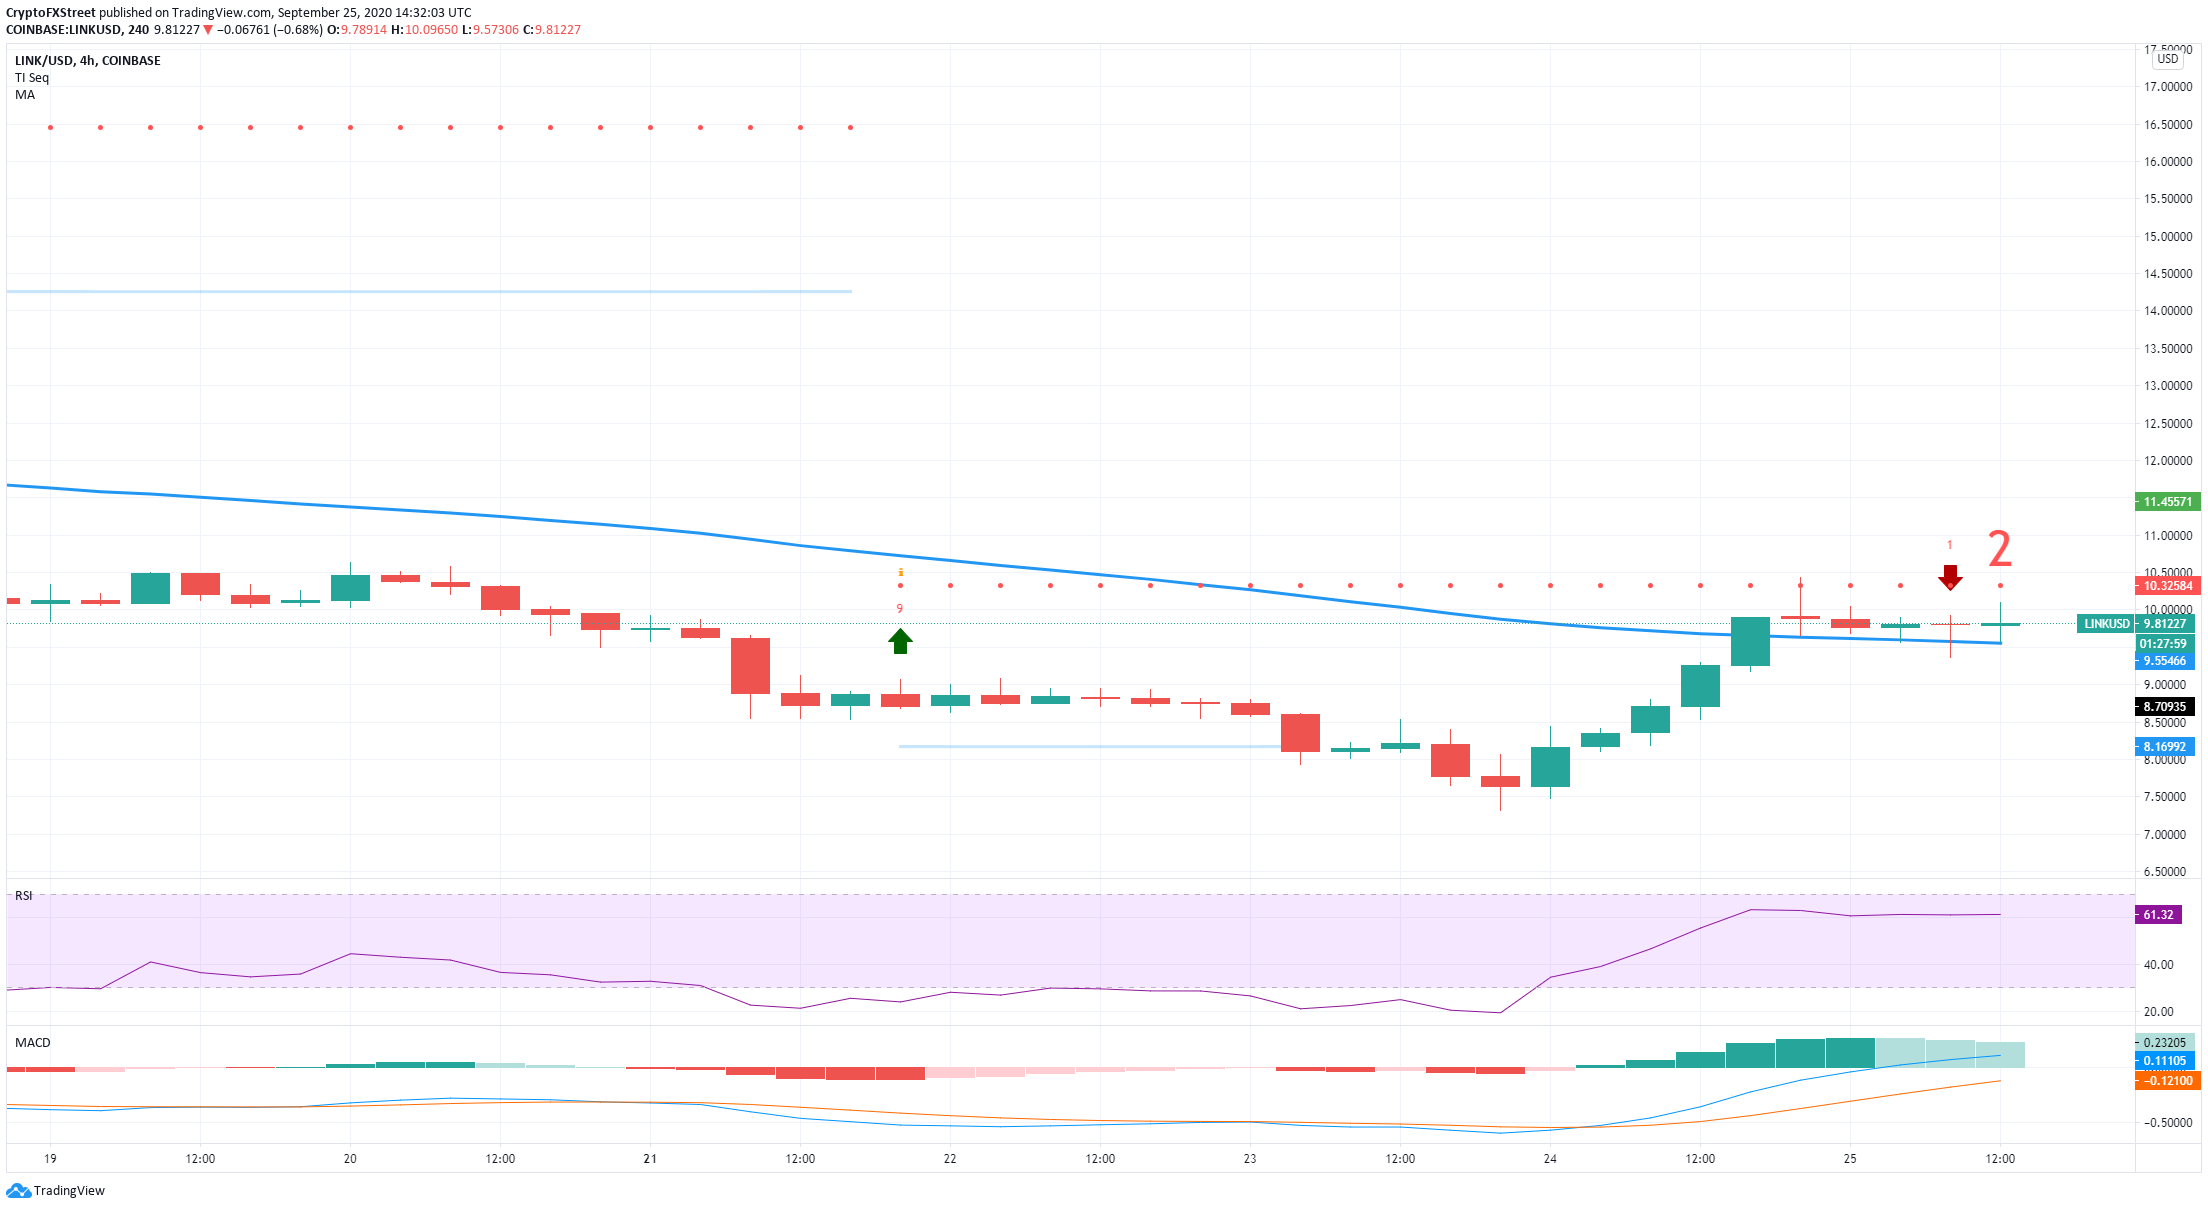
On the 4-hour chart, the TD sequential indicator has presented a sell signal, which would be validated further if LINK price closes below the 50-MA, currently sitting at $9.55.
The IOMAP chart above shows that the 50-MA currently coincides with the next support level at $9.56. It seems that bears will face very little opposition on the downside until $9, where 12.1 million LINK were bought, representing a robust support level.
On the other hand, although $10 is a psychological resistance level, the most significant cluster of LINK coins bought is $11, which means that if bulls can hold the 50-MA, we could very well see the price climb above $10 and target $11.
