- Chiliz price is contained inside a descending parallel channel on the 4-hour chart.
- The digital asset is one resistance level away from a 12% upswing towards $0.57.
- On-chain metrics show weak support below $0.48 for Chiliz.
Chiliz has been trading in a descending pattern since its all-time high of $0.94 on March 12. The digital asset seems ready for a breakout as the entire cryptocurrency market turned bullish in the past 24 hours.
Chiliz price must crack this key resistance level to jump higher
On the 4-hour chart, Chiliz has established a descending parallel channel with its upper boundary located at $0.507. Bulls have managed to defend the middle trendline and aim for a breakout towards $0.572, which is a 12% move calculated using the height from the top trendline to the bottom one.
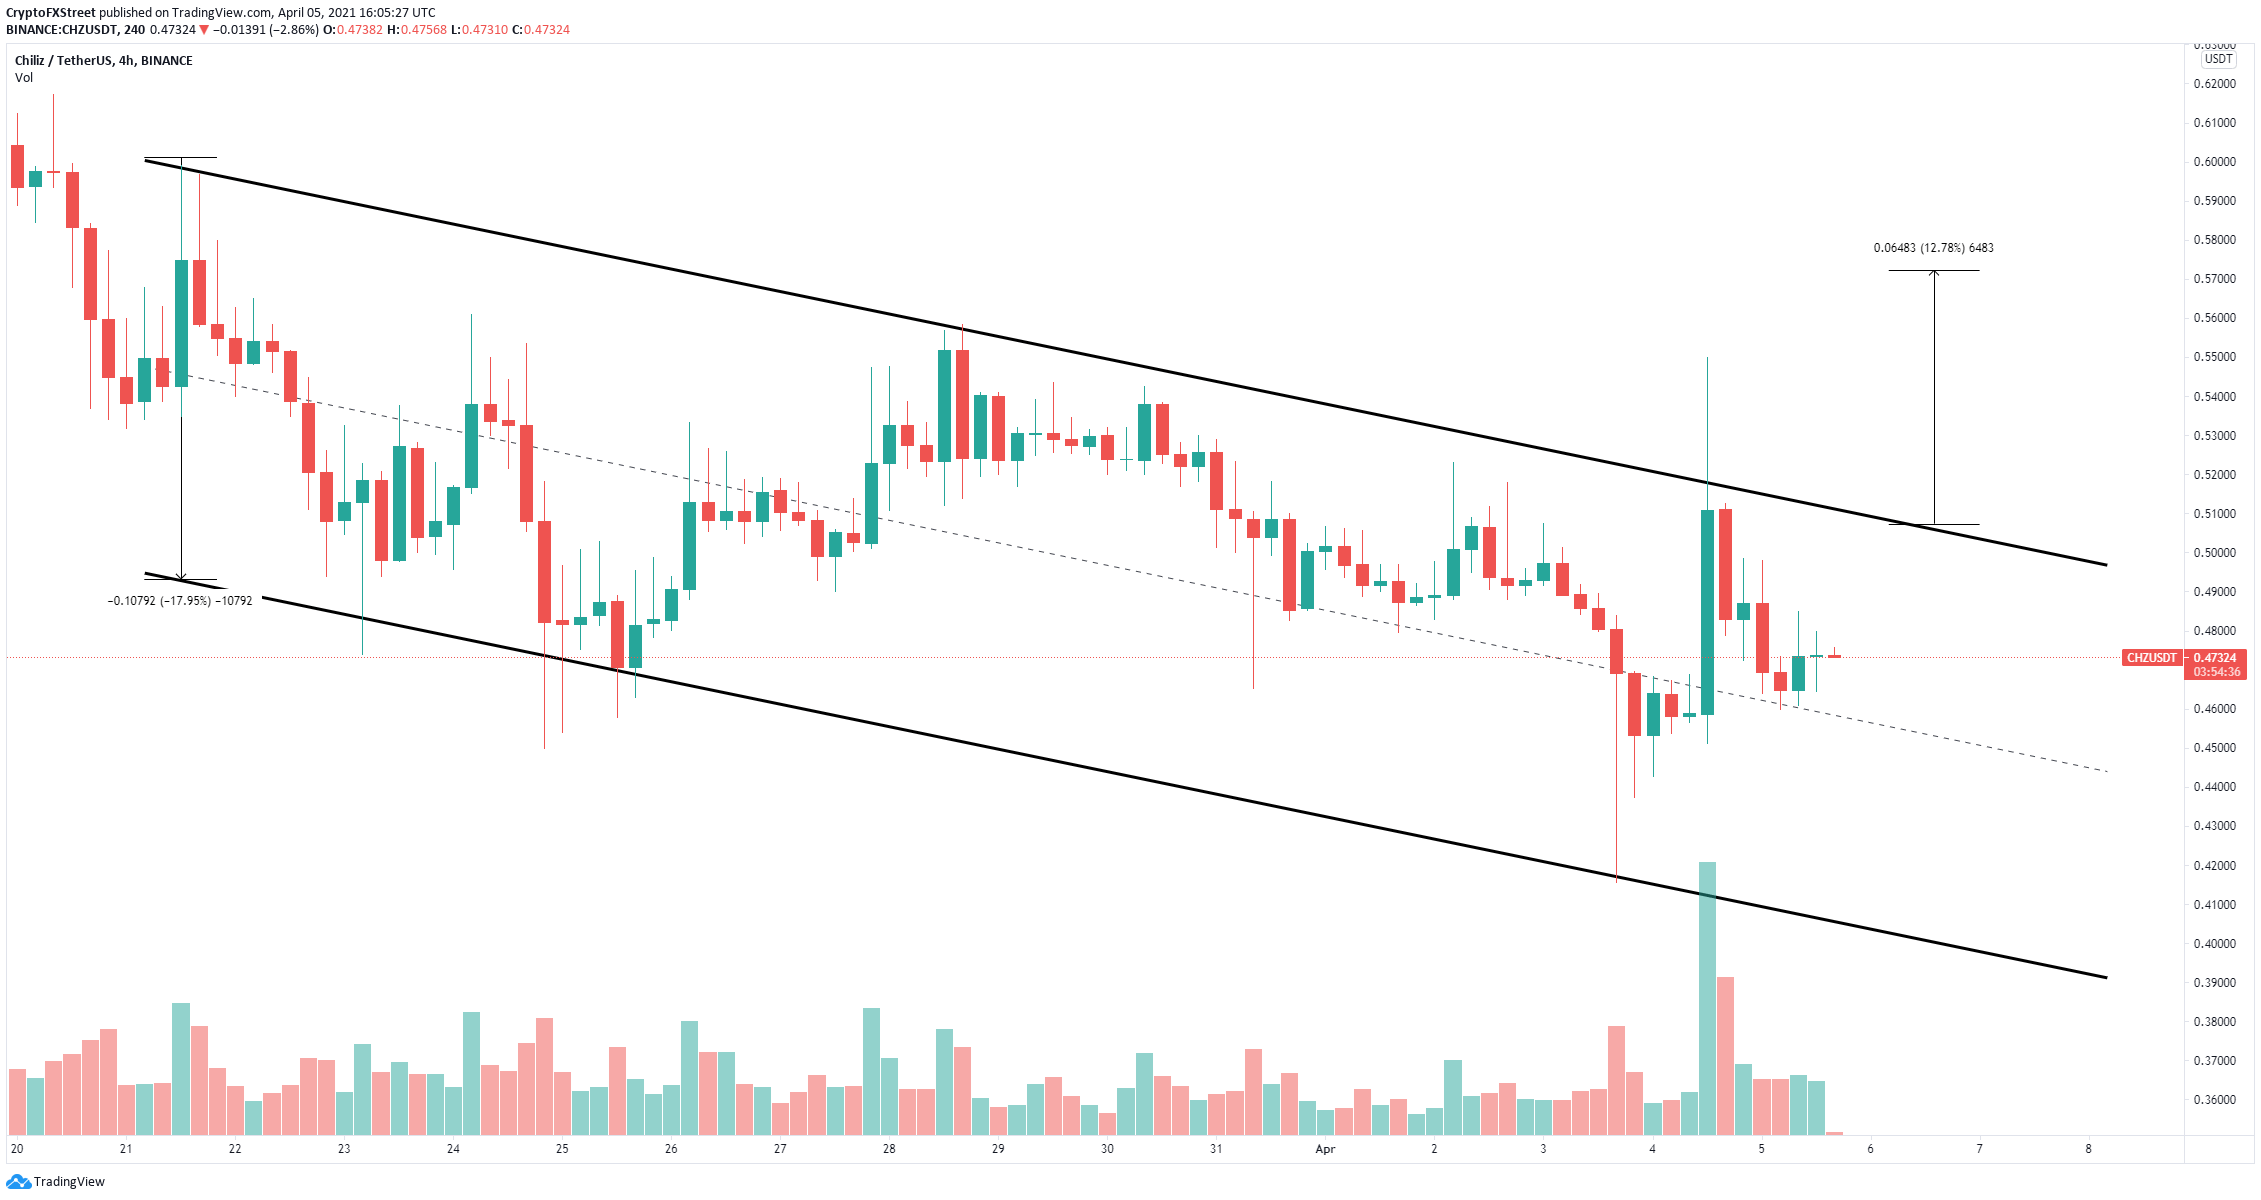
CHZ/USD 4-hour chart
The In/Out of the Money Around Price (IOMAP) chart shows a strong resistance area between $0.494 and $0.508, which coincides with the upper trendline of the pattern. There is another strong resistance point at $0.531 according to the IOMAP, which means that CHZ could briefly pause there before its final upswing to $0.572.
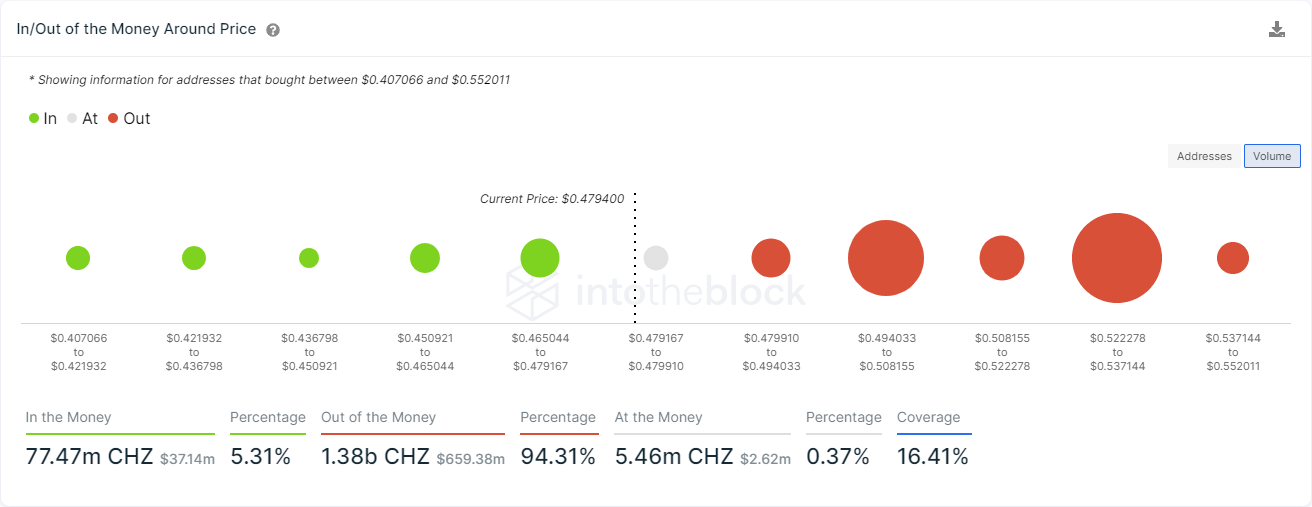
CHZ IOMAP chart
However, the IOMAP chart also shows fragile support below $0.48. If the bulls can’t see a breakout soon, CHZ could quickly drop towards the lower boundary of the descending channel at $0.405.
