- Cosmos price is contained inside an ascending parallel channel on the 12-hour chart.
- The digital asset must climb above a key resistance level to see a massive breakout.
- At the same time, bears could seek a comeback and push ATOM below a critical support level.
Cosmos has been trading sideways for the past two weeks. The digital asset is trading between two key levels that will determine the price action of ATOM for the next month.
Cosmos price on the verge of a massive breakout
ATOM has established an ascending parallel channel on the 12-hour chart. The digital asset faces a key resistance level at $20.4 in the form of the 50-SMA. Reclaiming this MA should quickly push Cosmos price towards the upper trendline at $22.5
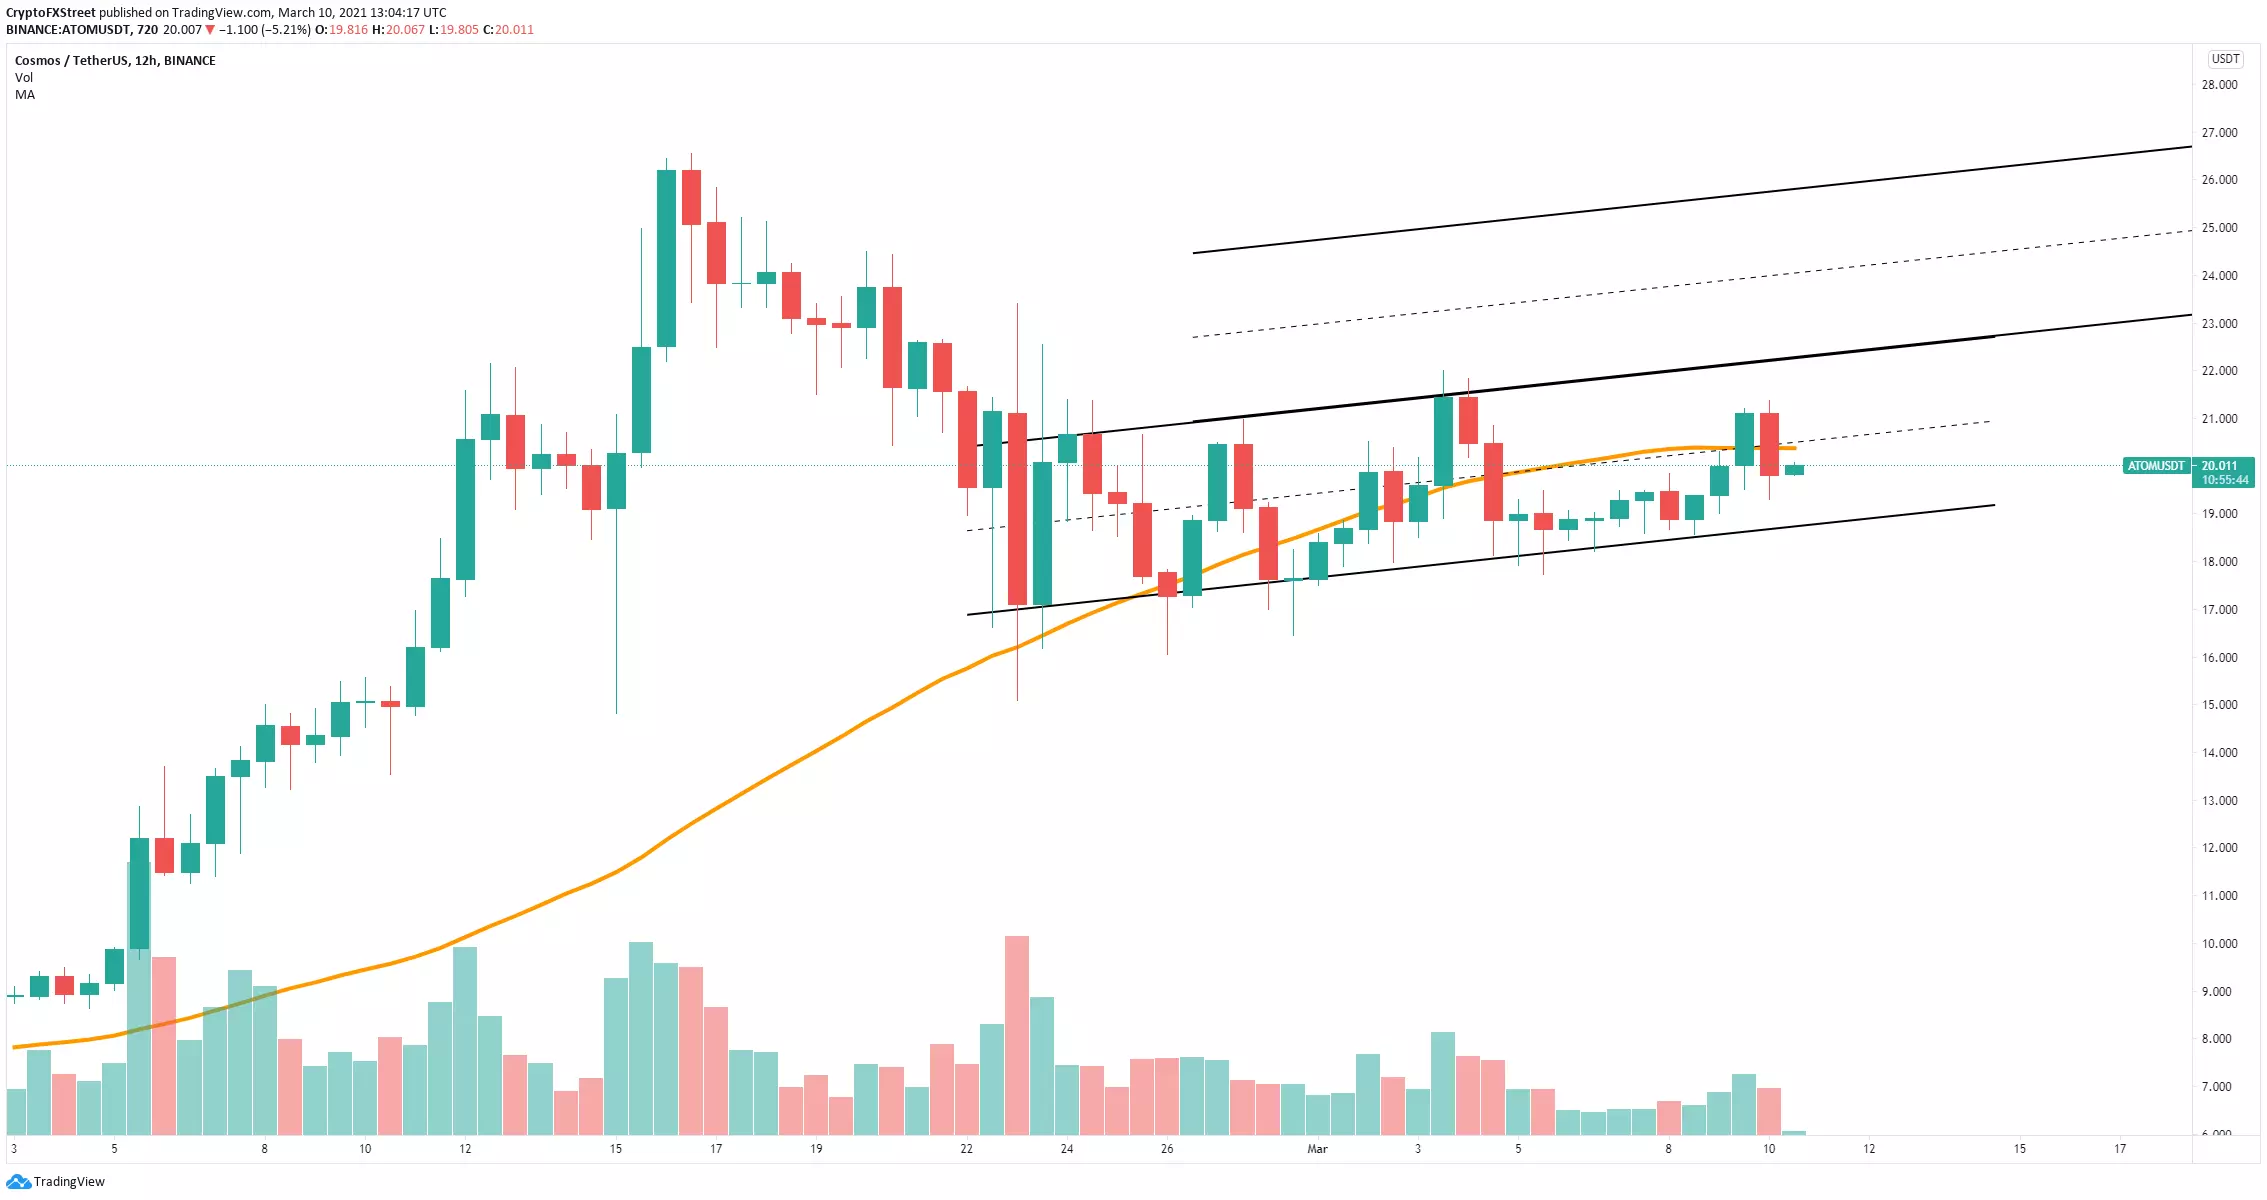
ATOM/USD 12-hour chart
A further breakout above $22.5 will drive Cosmos price to $24.3 and potentially up to $26.25 in the long-term.
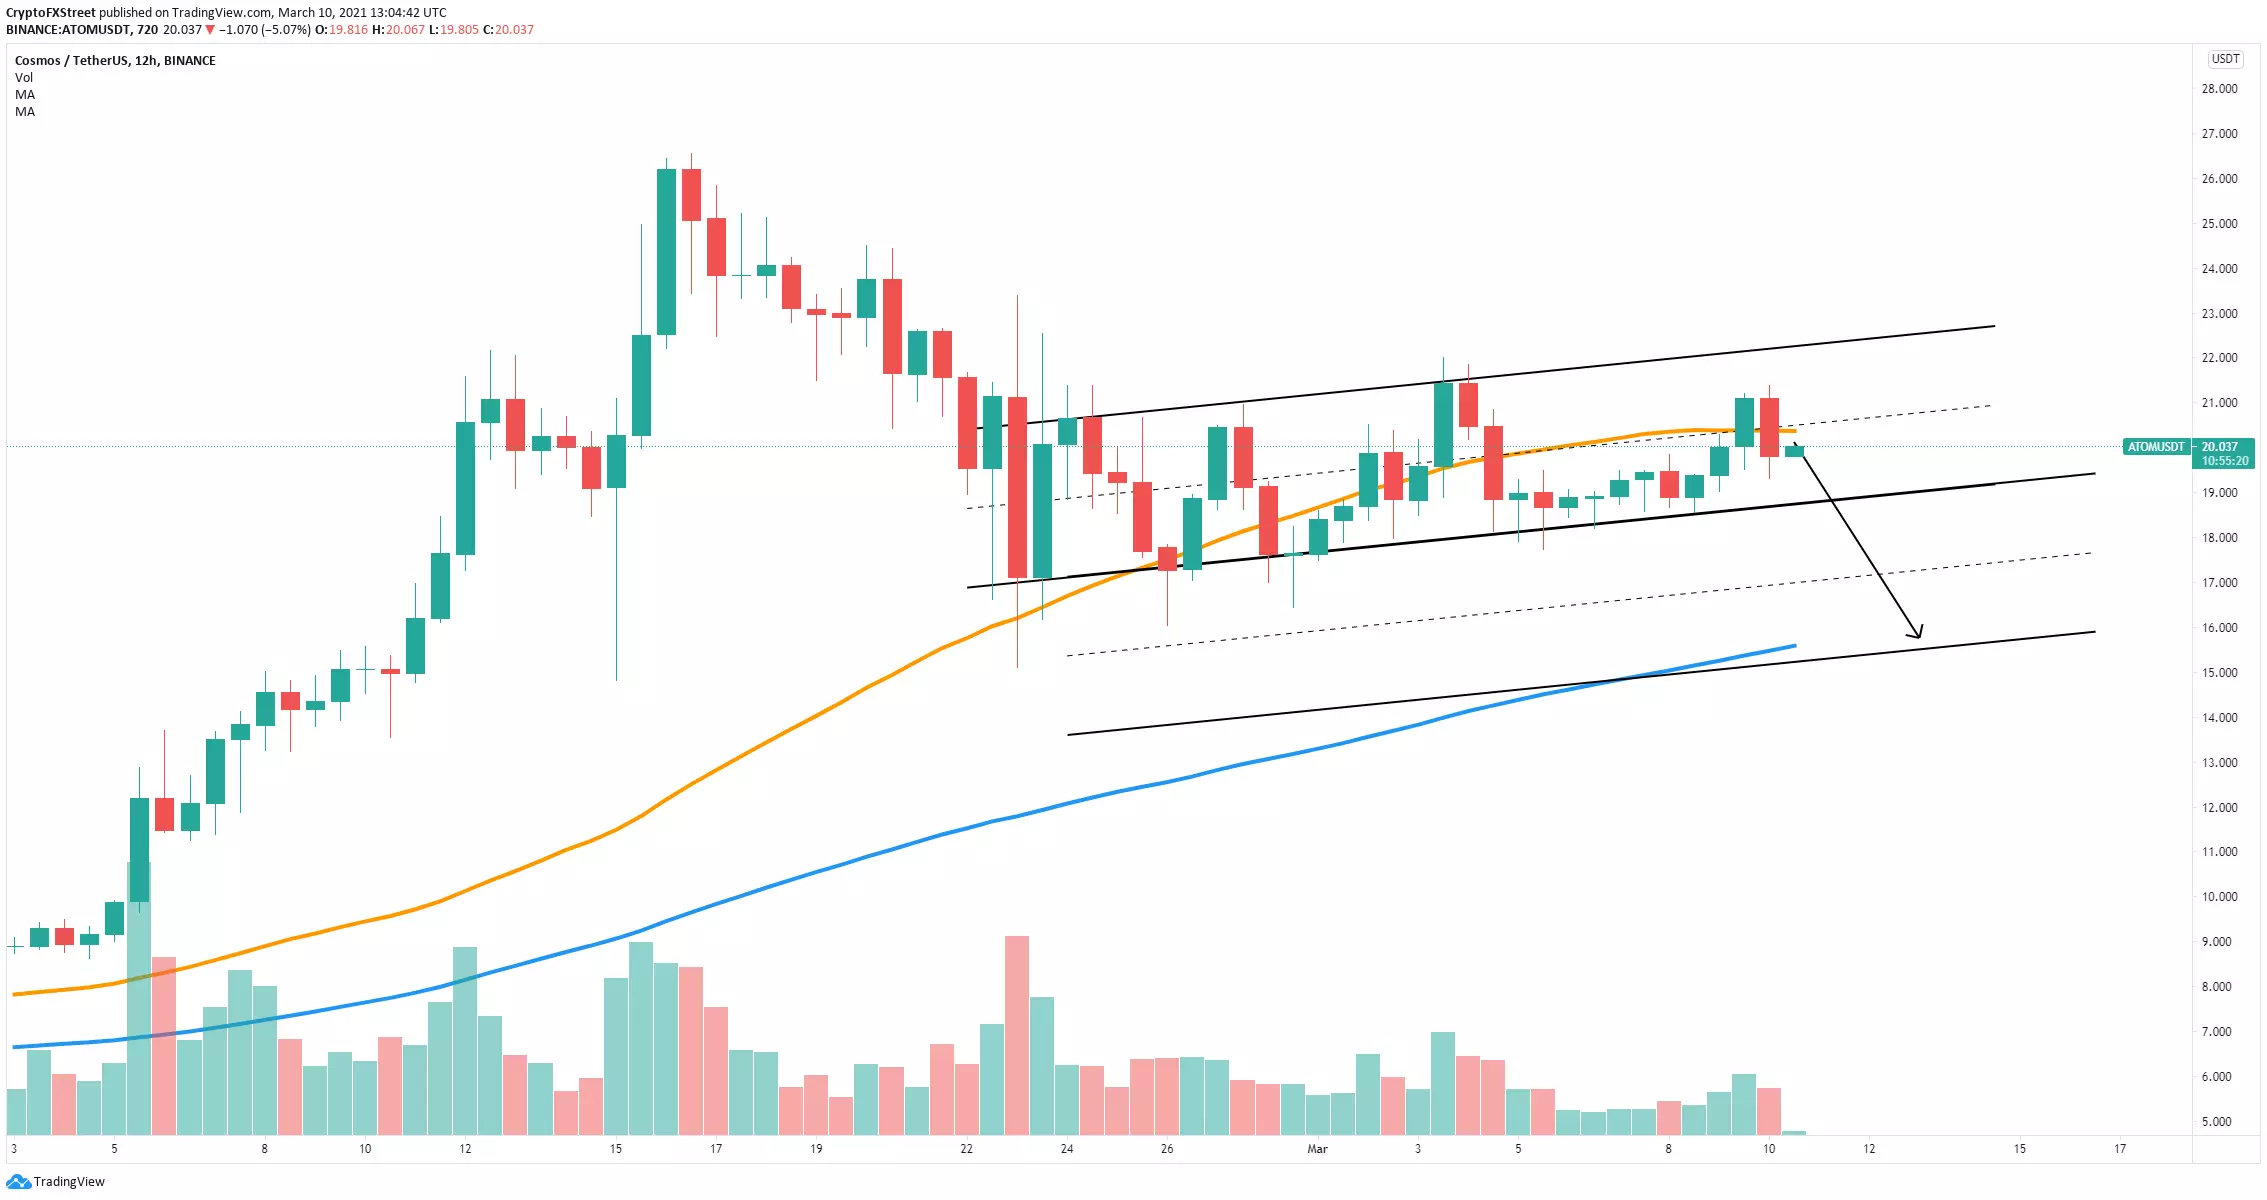
ATOM/USD 12-hour chart
However, a rejection from the 50-SMA will push ATOM towards the lower boundary of the channel at $19. A breakdown below this point will drive Cosmos price towards $15.7 at the 100-SMA.
