- DASH/USD fell from $109 to $106.25 in the early hours of Thursday.
- The SMA 200 curve has crossed over with the SMA 20 curve, which is a heavily bearish sign.
DASH/USD bears got back their control of the market in the early hours of Thursday, wherein the price fell from $109 to $106.25. Dash had a bullish Wednesday, following four straight bearish sessions. Looking at the hourly breakdown, we can see that the price spiked up from $106.25 to $109, before the bears took control and dipped the price to $106.25 in the next three hours.
DASH/USD daily chart
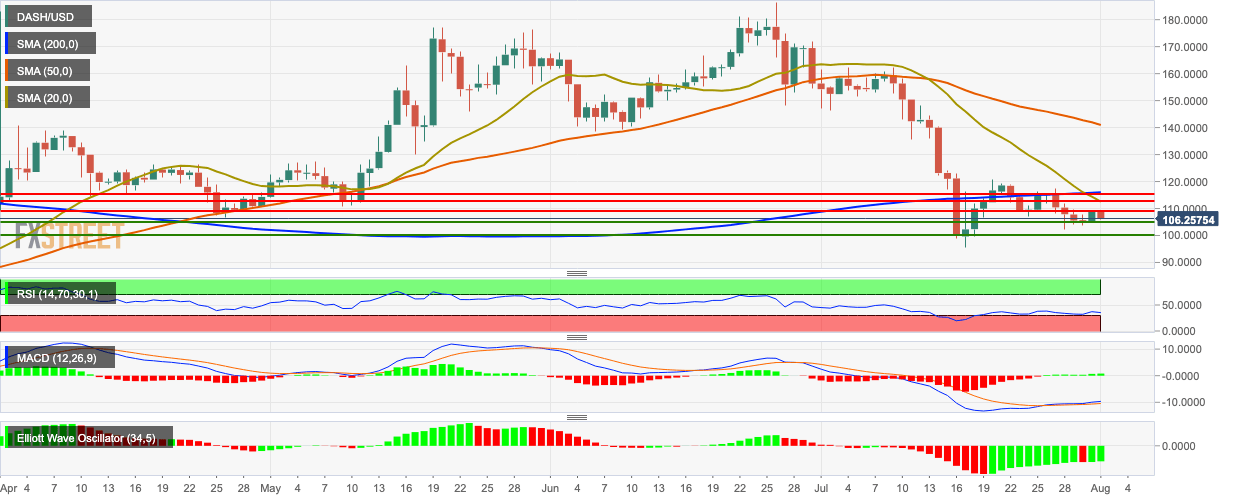
The daily price chart is below the 200-day simple moving average (SMA 200), SMA 50 and SMA 20 curves. The SMA 200 curve has crossed over the SMA 20 curve, which is a bearish sign. The relative strength index (RSI) indicator is trending around 36, right next to the oversold zone. The moving average convergence/divergence (MACD) indicator shows bullish momentum, while the Elliot oscillator shows two straight bullish sessions.
