- The MACD indicator shows a reversal of bearish momentum.
- The Elliott Oscillator has had five consecutive green sessions.
DASH/USD daily chart
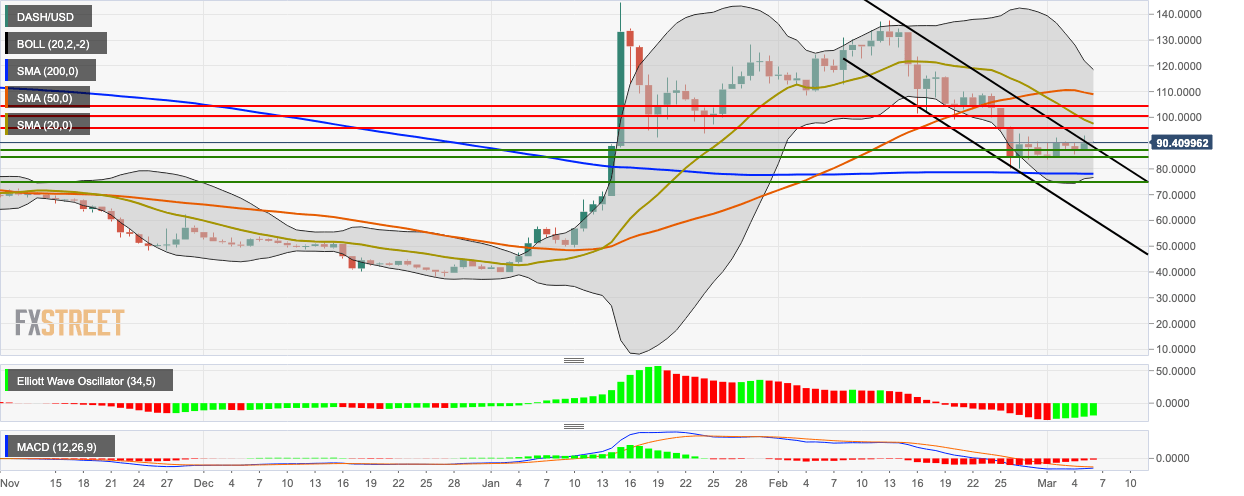
DASH/USD managed to chart two consecutive bullish days and break above the downward channel formation. In the early hours of Friday, DASH/USD went up from $90 to $90.58. The price is hovering above the SMA 200 curve and below the SMA 20 and SMA 50 curves. The signal line has touched the MACD line, indicating a reversal of bearish momentum, while the Elliott Oscillator had had five consecutive green sessions. Both these indicators show that the price may go up even more.
