- DASH/USD went down from $155.75 to $153.80 this Friday.
- Technical analysis shows that overall market sentiment is bearish.
DASH/USD is on the course of having two bearish days in a row. Five out of the last six days has been bearish for DASH/USD. Looking at the hourly chart, the price of DASH/USD went up to $162 towards the end of Thursday, before it fell to $153.75 in just seven hours. Technical analysis shows that overall market sentiment is heavily bearish.
DASH/USD daily chart
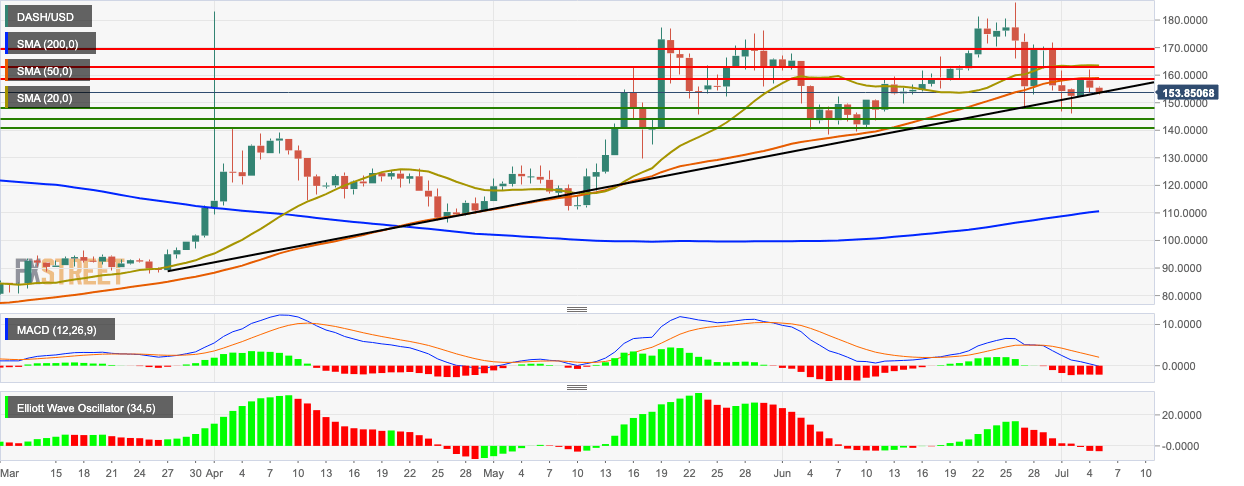
The daily price chart is trending below the 20-day simple moving average (SMA 20) and SMA 50 curves but has found support on the upward trending line. The moving average convergence/divergence (MACD) indicator has had seven straight bearish sessions, while the Elliot oscillator has had nine consecutive bearish sessions. All these factors indicate that the overall market sentiment is strongly bearish.
