- Dash price remains contained inside a symmetrical triangle pattern on the 12-hour chart.
- A clear breakout above the pattern can easily drive Dash price towards a target of $160 in the long-term.
The digital asset has been trading relatively sideways for close to one month and awaits a clear breakout or breakdown within the next week. It seems that bulls have taken control again and are eying up a potential price target of $160.
Dash price needs to crack this critical resistance level to see a massive breakout
On the 12-hour chart, DASH has established a symmetrical triangle pattern and it’s trading right in the middle of it. Bulls have defended the lower trendline support at $95 and Dash price rebounded towards $106.
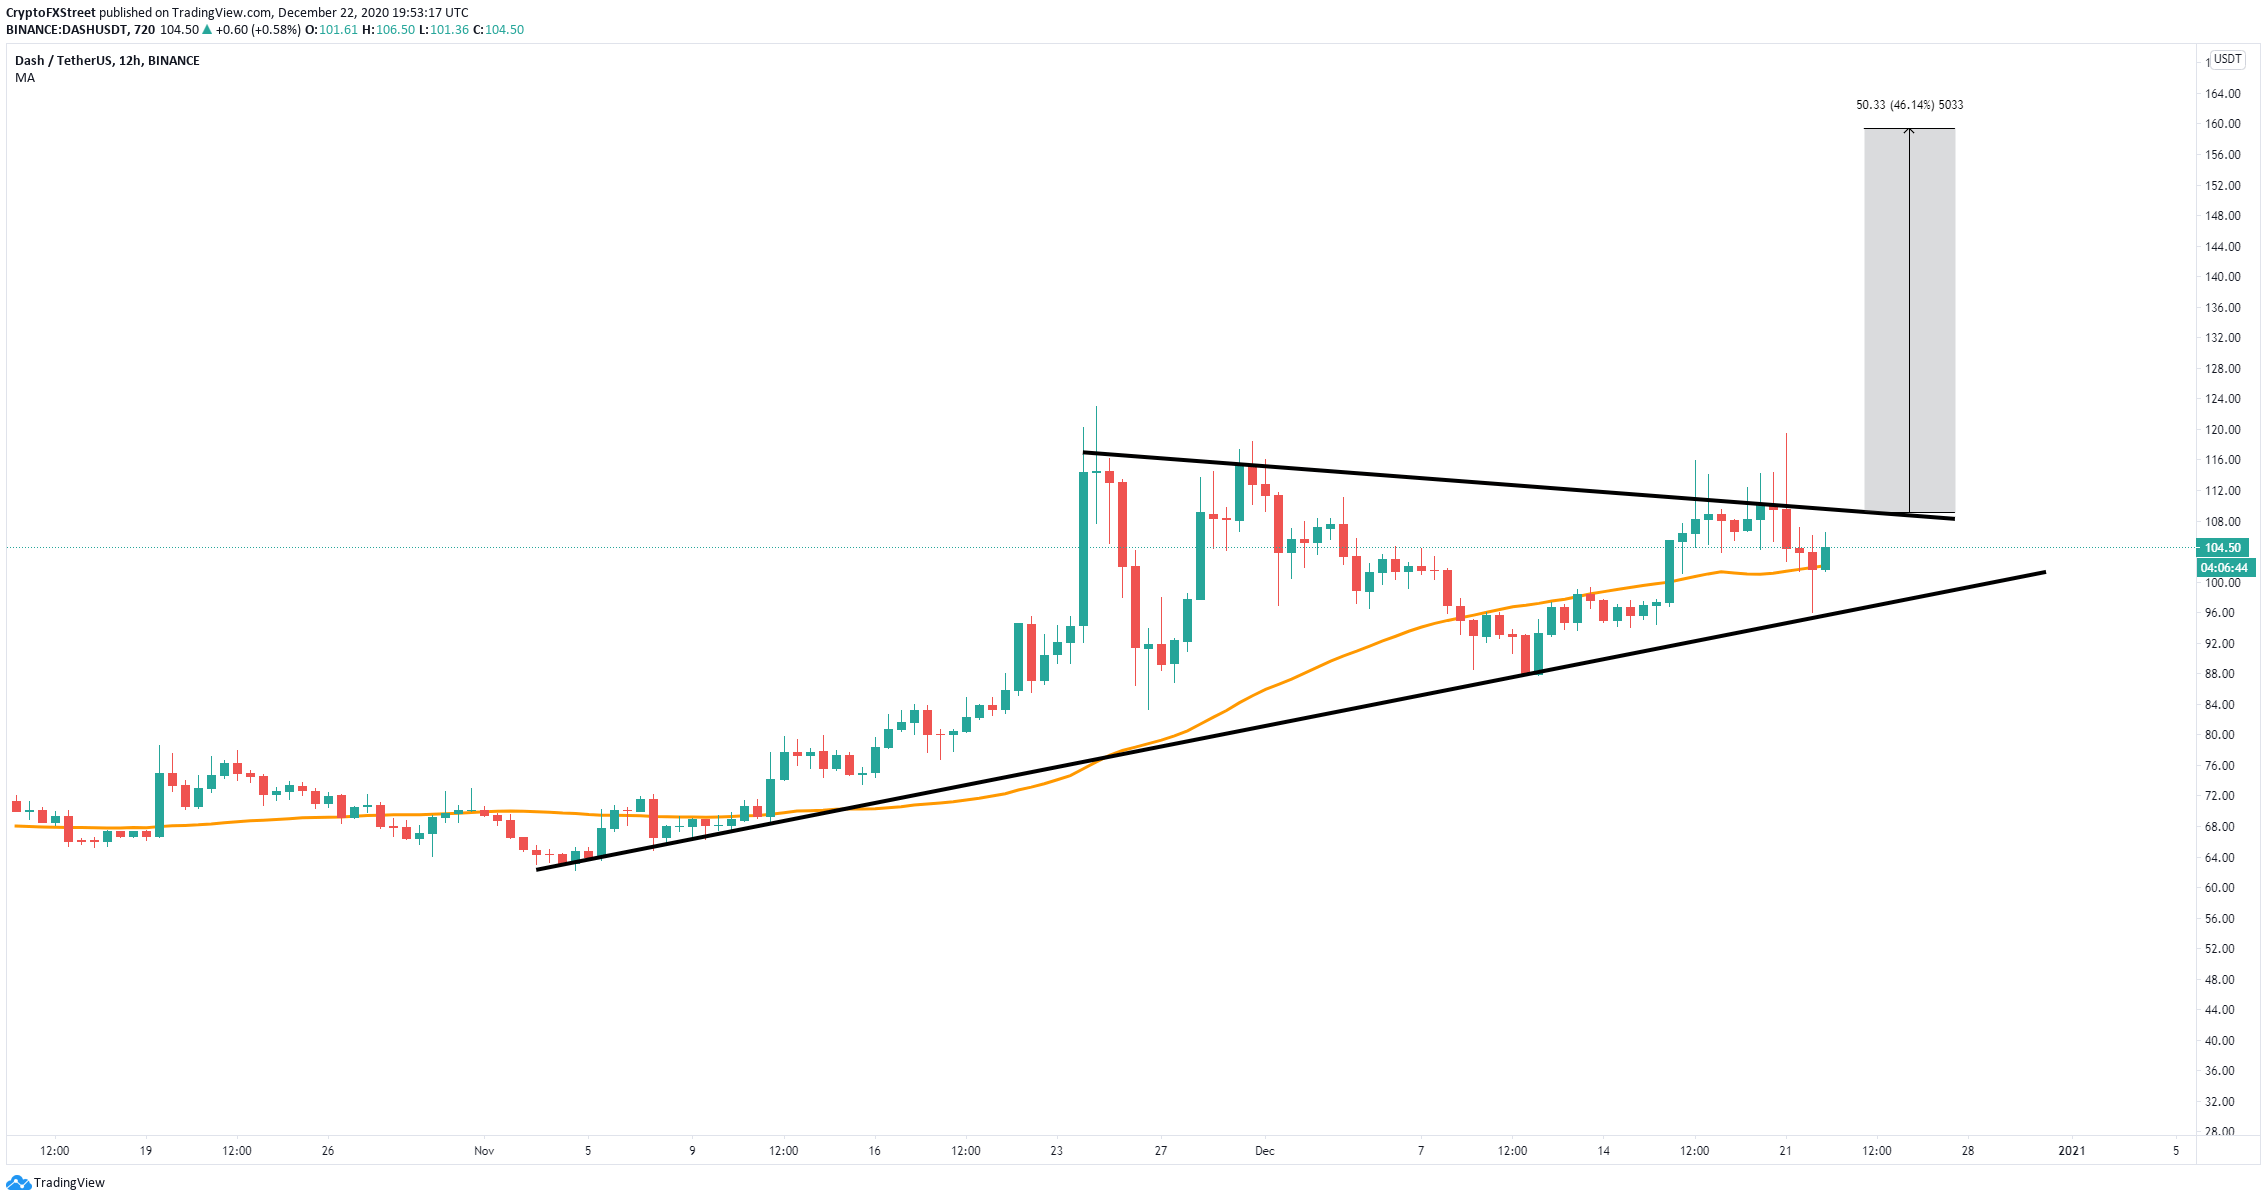
DASH/USD 12-hour chart
The digital asset has also climbed above the 50-SMA, turning it into a support level. The next resistance level is located at $109, which is the upper trendline of the pattern. A breakout above this point can push Dash price towards $160.
-637442637442663947.png)
DASH IOMAP chart
On the other hand, failure to hold the 50-SMA at $102 will most likely drive DASH towards the lower trendline of the pattern again at $95. The In/Out of the Money Around Price (IOMAP) chart shows very little support around this area.
The IOMAP chart suggests that a breakdown below $95 might be likely as the most significant support area is located below $91. This adds credence to the bearish outlook given above.
