- Bulls rallied back this Thursday as DASH/USD’s value increased by 2.82% in the last 24 hours.
- Bulls are currently testing resistance at $68.50 as technical indicators show that the market is becoming more volatile.
DASH/USD bulls thoroughly beat the bears this Thursday as market value went up by 2.82% in the last 24 hours. Bulls need to break past the resistance at $68.50 to make up for this Wednesday’s losses. Since technical indicators show that the market is becoming more volatile, more price movement is expected.
DASH/USD daily chart
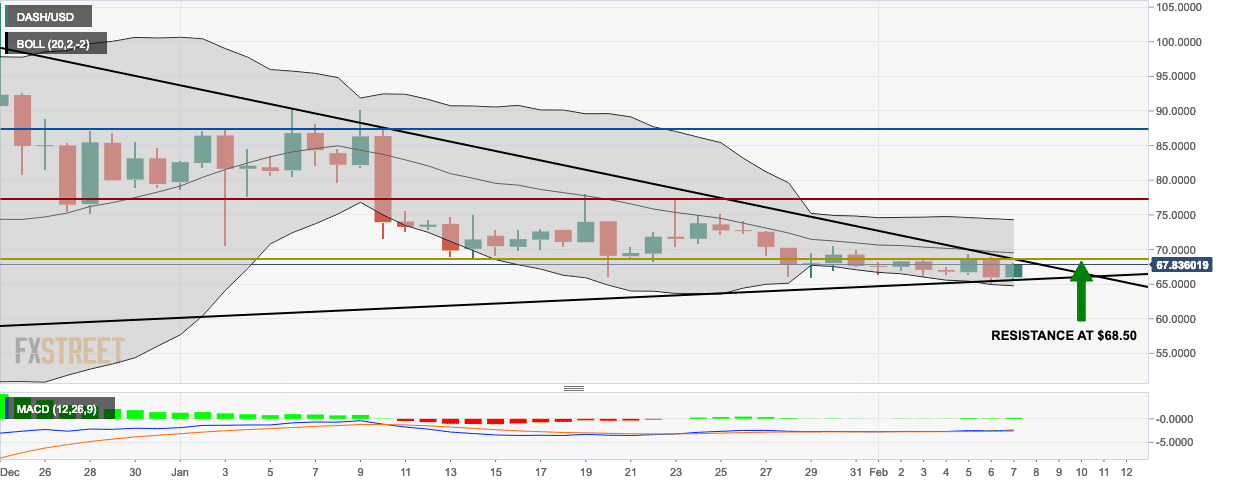
The DASH/USD daily chart shows that the market is about to break out from a triangle formation. To make sure that the breakout is bullish, the buyers will need to do the following:
- Break past the resistance at $68.50.
- Break past the resistance offered by the downward trending line.
The widening of the 20-day Bollinger band and the movement in the moving average convergence/divergence histogram both indicate that the market is becoming more volatile. More price movement is expected.
