- DOGE Price in a sideways price action defined by a tight range.
- Dogecoin upward movement hindered by the 200-SMA.
- IOMAP Model reveals DOGE faces massive resistance upwards.
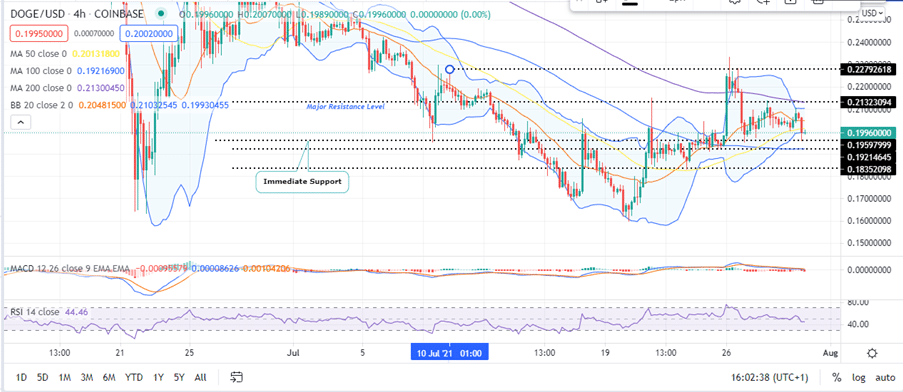
DOGE price opened the day on Friday trading in the greed as shown on the Four-hour chart. Dogecoin is holding onto crucial support at around $0.195 as bulls attempt to push the price above the $0.20 psychological level. At the time of writing, the meme cryptocurrency was exchanging hands at $0.1996 on most crypto trading exchanges with no noticeable movement in either direction.
DOGE Price Trades in a Tight Range
Dogecoin price has been trading in a tight range between $0.198 and $0.210 since July 27 with little or no movement either way. The appearance of a green doji candlestick on the 4-hour chart suggests indecision in market as bulls and bears cancel out. It also suggests that the Dogecoin price could break out either way.
The four-hour Bollinger Band (BB) adds credence to DOGE price consolidation. This is shown by the squeezing of the Bollinger Bands towards each other, indicating decreasing price volatility.
Moreover, the Moving Average Convergence Divergence (MACD) indicator validates this price consolidation by its sideways movement. . Similarly, the RSI is moving sideways, an indication that the Dogecoin price is in a sideways price action. Furthermore, the RSI is typically in mid-range at around 46.15, which is a show of consolidation of the DOGE price.
Read our detailed guide for more crypto signals to help you make better trading decisions.
At the moment, the Dogecoin price prediction appears bearish for the next trading as bears are determined to break the immediate support at the $0.196 mark. A four-hour candlestick closure below this level could see the Dogecoin price swing low below the $0.921 support area to revisit the July 23 low at $0.183 or the July 20 low at around the $0.160 psychological zone.
DOGE Price Four-Hour Chart
Dogecoin Faces an Uphill Task
Note that a bullish breakout will take place if DOGE closes the day above the $0.20 psychological level. However, things might not be rosy for Dogecoin bulls are the journey upwards is met with massive resistance.
According to on-chain metrics from Into/Out of the Money Around Price (IOMAP) model by IntoTheBlock, the point where immediate major resistance level coincides the 200-SMA at $0.213 is within the $0.212 and $0.218 price range. At this range around 56,000 addresses previously bought approximately 2 billion DOGE.
Therefore, slicing through these resistance zones will be an uphill task for DOGE price bulls.
Dogecoin IOMAP Model
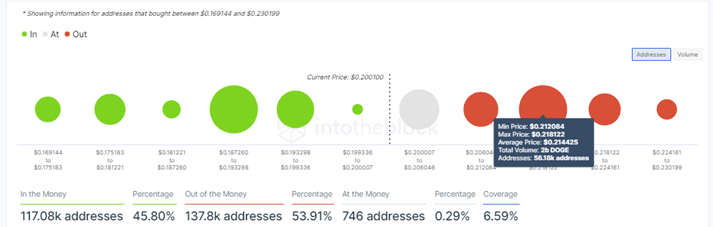
On the other hand, the IOMAP model also shows that DOGE’s immediate support at $0.199 is very weak as it sits within the $0.199 and $0.200 range. Within this range, only about 746 addresses previously bought approximately 28 million DOGE.
Looking to buy or trade DOGE now? Invest at eToro!
Capital at risk
