- Dogecoin price is contained inside a descending triangle pattern on the 4-hour chart.
- The digital asset is on the verge of a massive 30% breakout towards $0.09.
- A key indicator has just presented a buy signal giving credence to the bulls.
Dogecoin price has finally calmed down after the massive pump and dump generated by Elon Musk and the Reddit group known as WallStreetBets. Now, the digital asset is on the verge of another massive move within the next 24 hours.
Dogecoin price on the brink of a 30% move
On the 4-hour chart, Dogecoin price has established a descending triangle pattern which is on the verge of a break. Climbing above $0.07 will confirm a bullish breakout towards $0.09, a 30% move.
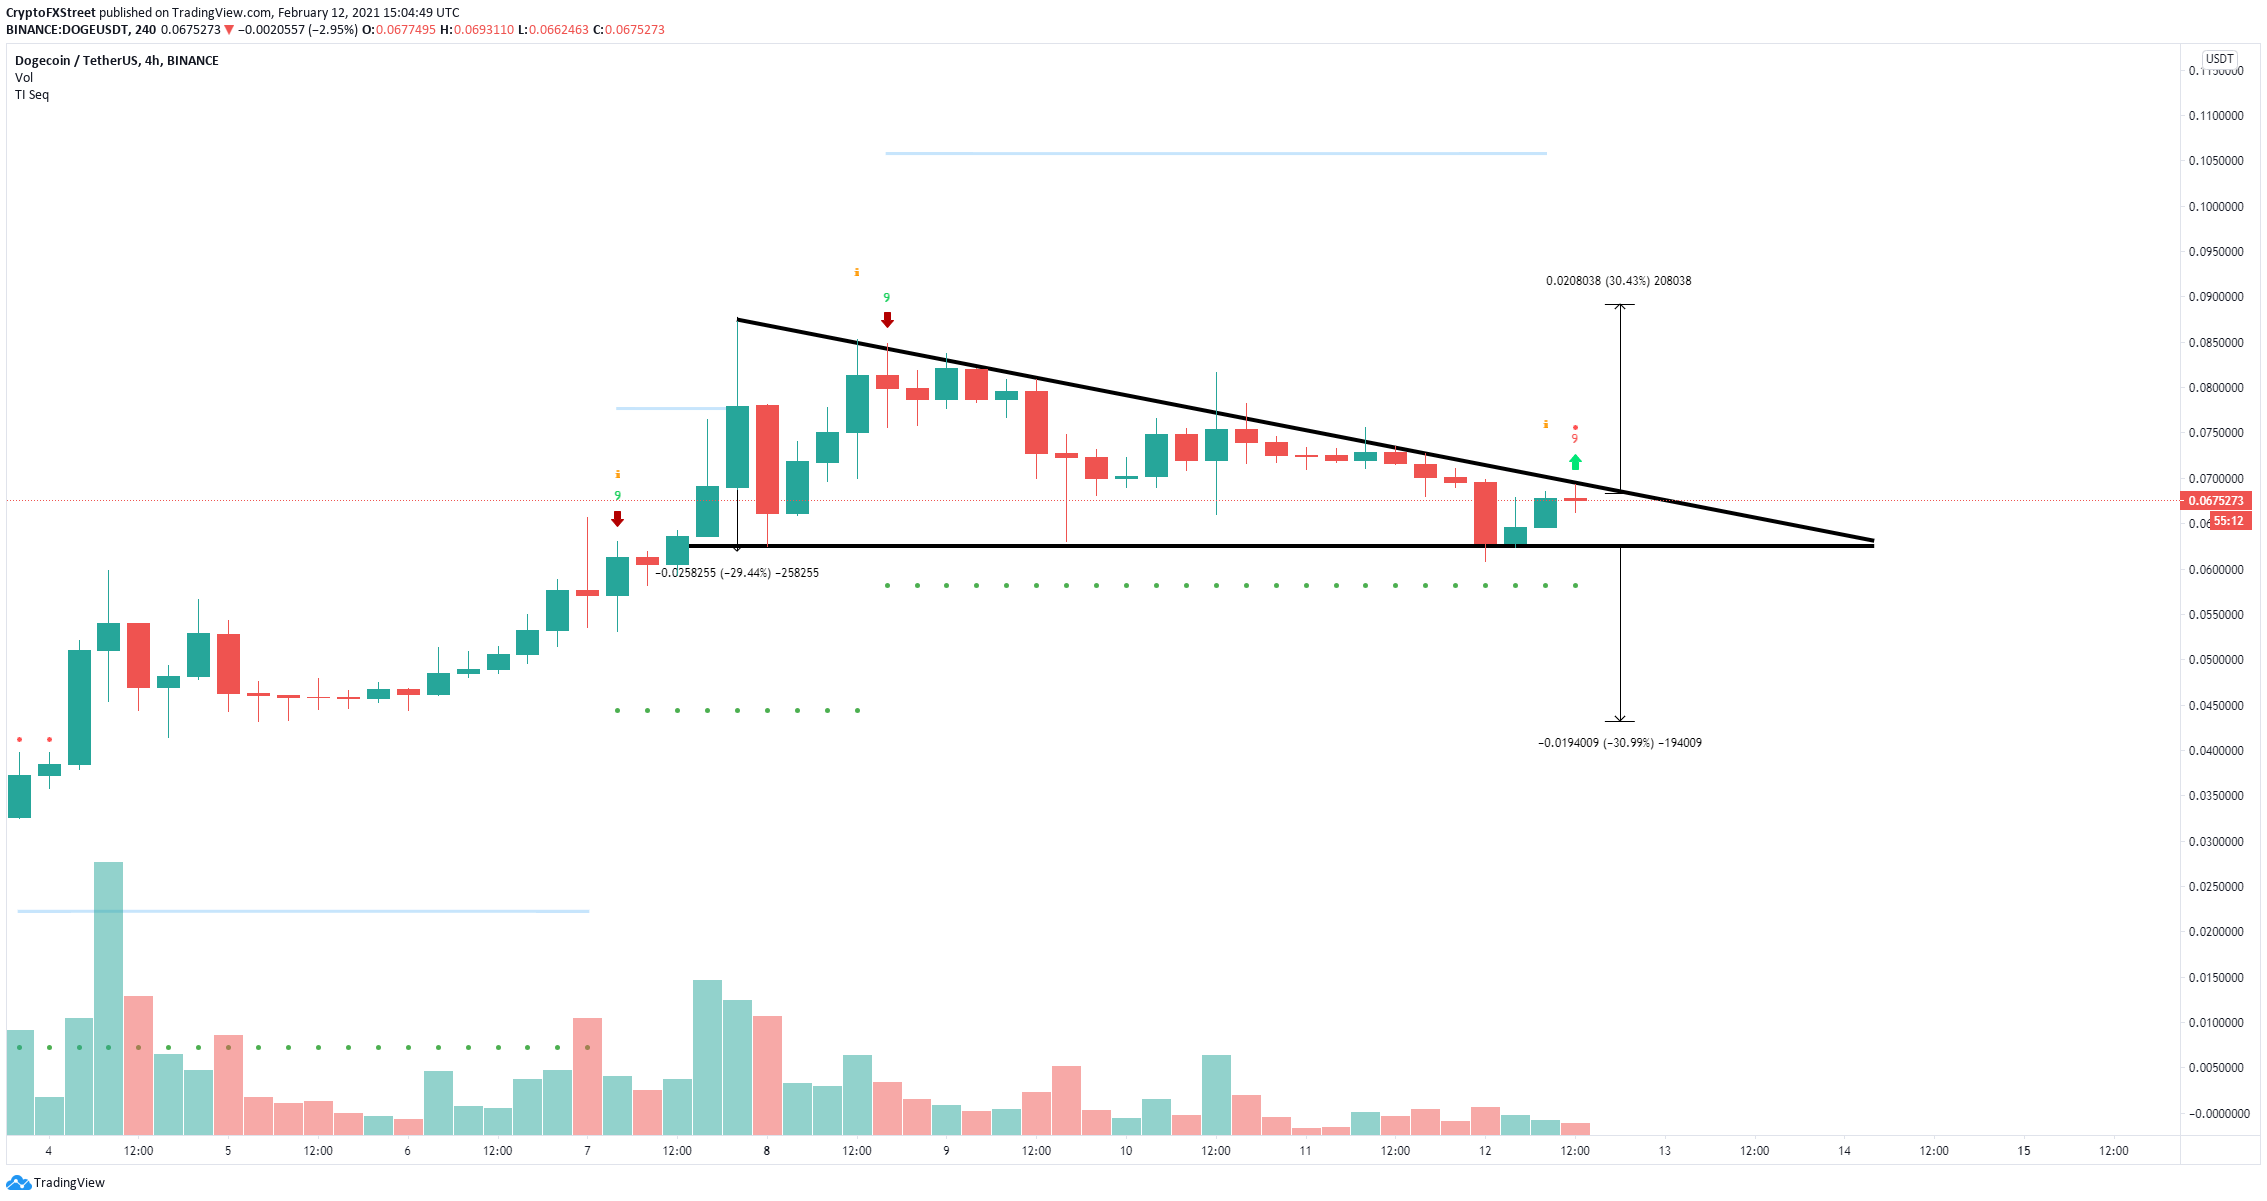
DOGE/USD 4-hour chart
The breakout is more likely thanks to a buy signal just presented by the TD Sequential indicator on the 4-hour chart. Dogecoin price is $0.067 at the time of writing, around 2% away from a potential breakout.
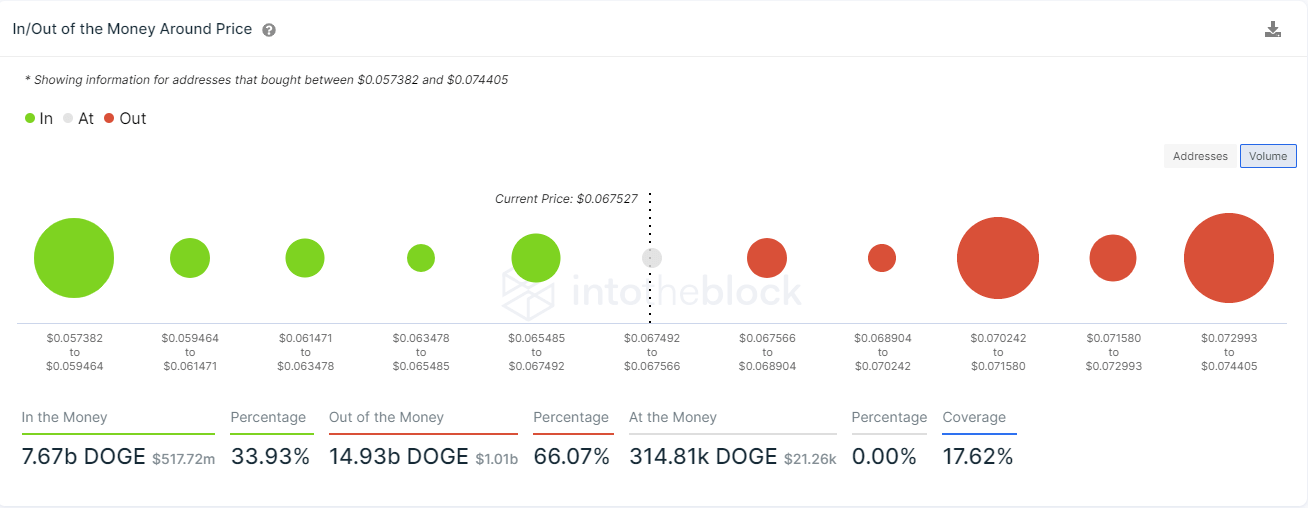
DOGE IOMAP chart
On the other hand, the In/Out of the Money Around Price (IOMAP) chart shows stronger resistance on the way up, especially between $0.07 and $0.071, which coincides with the level above.
The lower support trendline is formed at $0.062, which shouldn’t be too hard for the bears to break according to the IOMAP model. Losing this key level can drive Dogecoin price down to $0.043.
