- DXY is located in the seller’s territory, so a deeper drop is natural
- Technically, it has escaped from a minor range which was seen as a continuation pattern.
- DXY’s drop towards the weekly S1 indicates that the USD could resume its depreciation.
The DXY Dollar Index price has increased slightly in the last hours, but the bias remains bearish. It could drop deeper anytime, so you can still look for selling the US Dollar. As you already know, the dovish Fed Chair Powell’s remarks at the Jackson Hole Symposium have weakened the DXY. That’s why the USD has depreciated versus its rivals.
–Are you interested to learn more about ECN brokers? Check our detailed guide-
Technically, DXY could come back only to test and retest the immediate resistance levels (support has turned into resistance) before dropping deeper. However, it remains to see how the index will react ahead of the United States Non-Farm Payrolls, Unemployment Rate, and Average Hourly Earnings. These high-impact economic indicators will be released on Friday and could bring sharp movements.
Today, the US is to release the Pending Home Sales data. The economic indicator is expected to register a 0.5% growth in July versus a -1.9% drop in June. Also, on Wednesday, the ADP Non-Farm Employment Change and the ISM Manufacturing PMI could shake the markets and bring some volatility to the DXY.
Dollar Index price technical analysis: Resistance retest in action
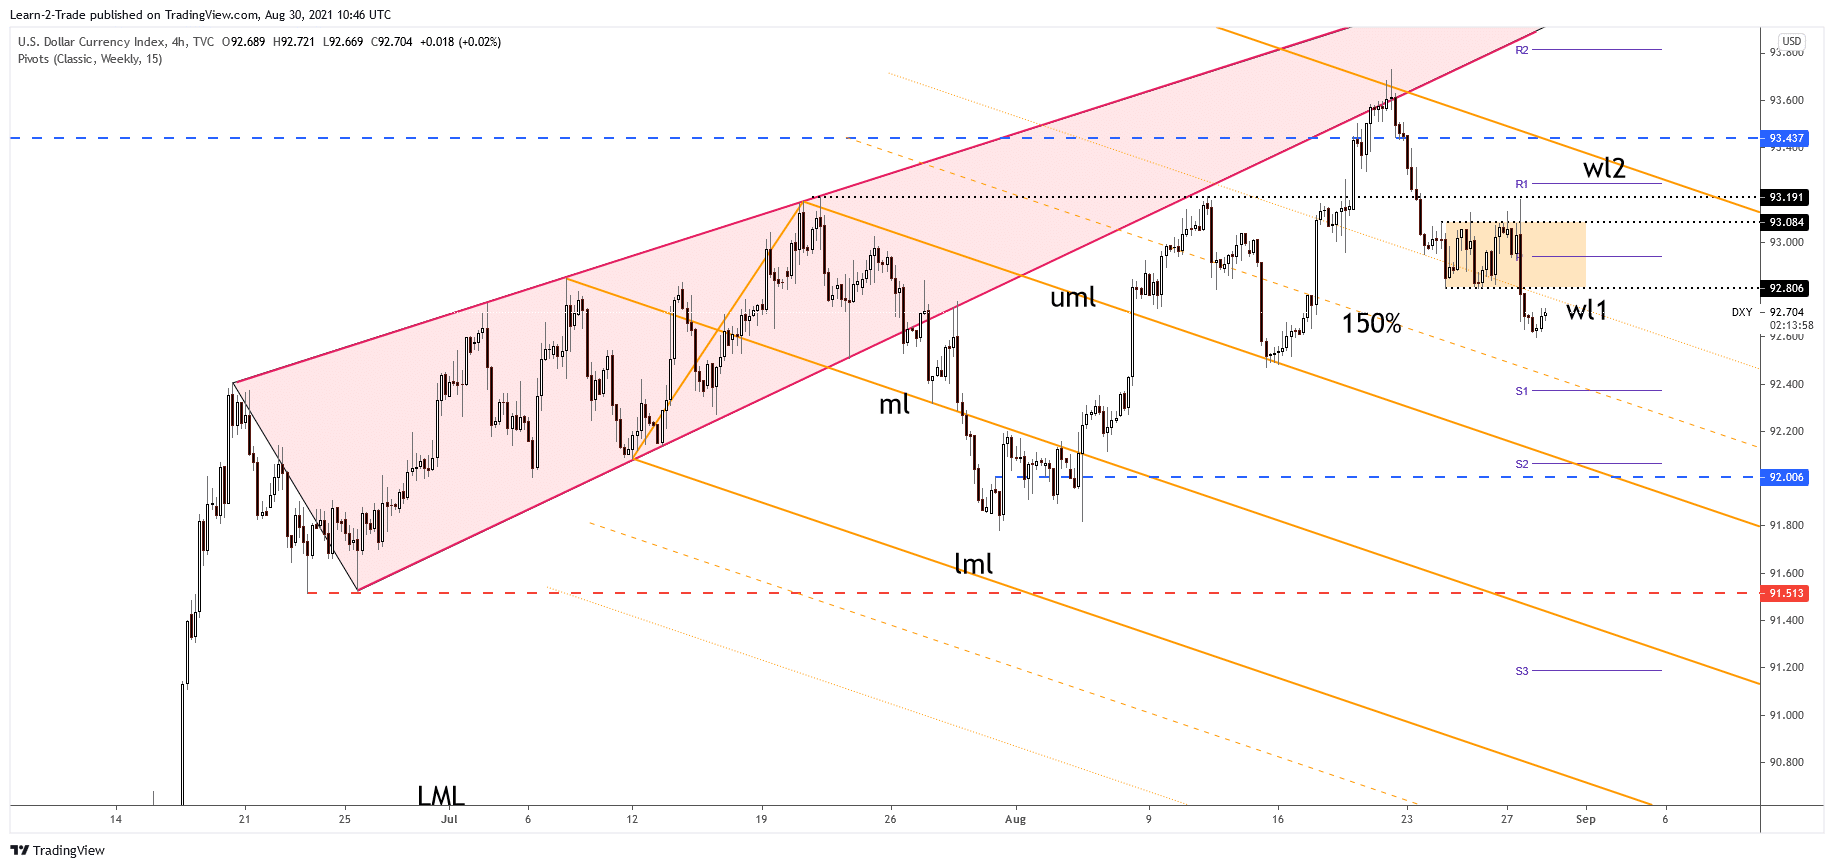
The Dollar Index has found support at 92.59 and now is traded at 92.70. It could come back to retest the first warning line (wl1) of the descending pitchfork. In the short term, the DXY could drop deeper as long as it stays below the warning line.
–Are you interested to learn more about making money in forex? Check our detailed guide-
As you can see on the h4 chart, the index has registered another false breakout through the 93.08 level, so a downside breakout from the previous range was expected. The aggressive breakdown through the confluence area formed at the intersection between 92.80 with the warning line (wl1). Technically, the 150% Fibonacci line of the descending pitchfork and the weekly S1 (92.37) are seen as potential downside targets. Unfortunately, its failure to reach the second warning line (wl2) signaled the bearish pressure.
The DXY price has registered only a false breakout above 93.43 higher-high, which was seen as a major static resistance. However, dropping deeper, DXY signals that the US Dollar could depreciate versus its rivals against the other major currencies.
Looking to trade forex now? Invest at eToro!
67% of retail investor accounts lose money when trading CFDs with this provider. You should consider whether you can afford to take the high risk of losing your money.
