- Enjin Coin price is contained inside a symmetrical triangle pattern on the 12-hour chart.
- On-chain metrics suggest that ENJ is on the brink of a significant crash.
- Whales have sold a significant number of ENJ coins in the past few weeks, adding selling pressure to the asset.
Enjin Coin price has been trading inside a tightening range on the 12-hour chart. Several metrics indicate that the digital asset is on the brink of a significant correction as whales are taking profit and increasing the selling pressure of the coin.
Enjin Coin price could slip toward $1.44
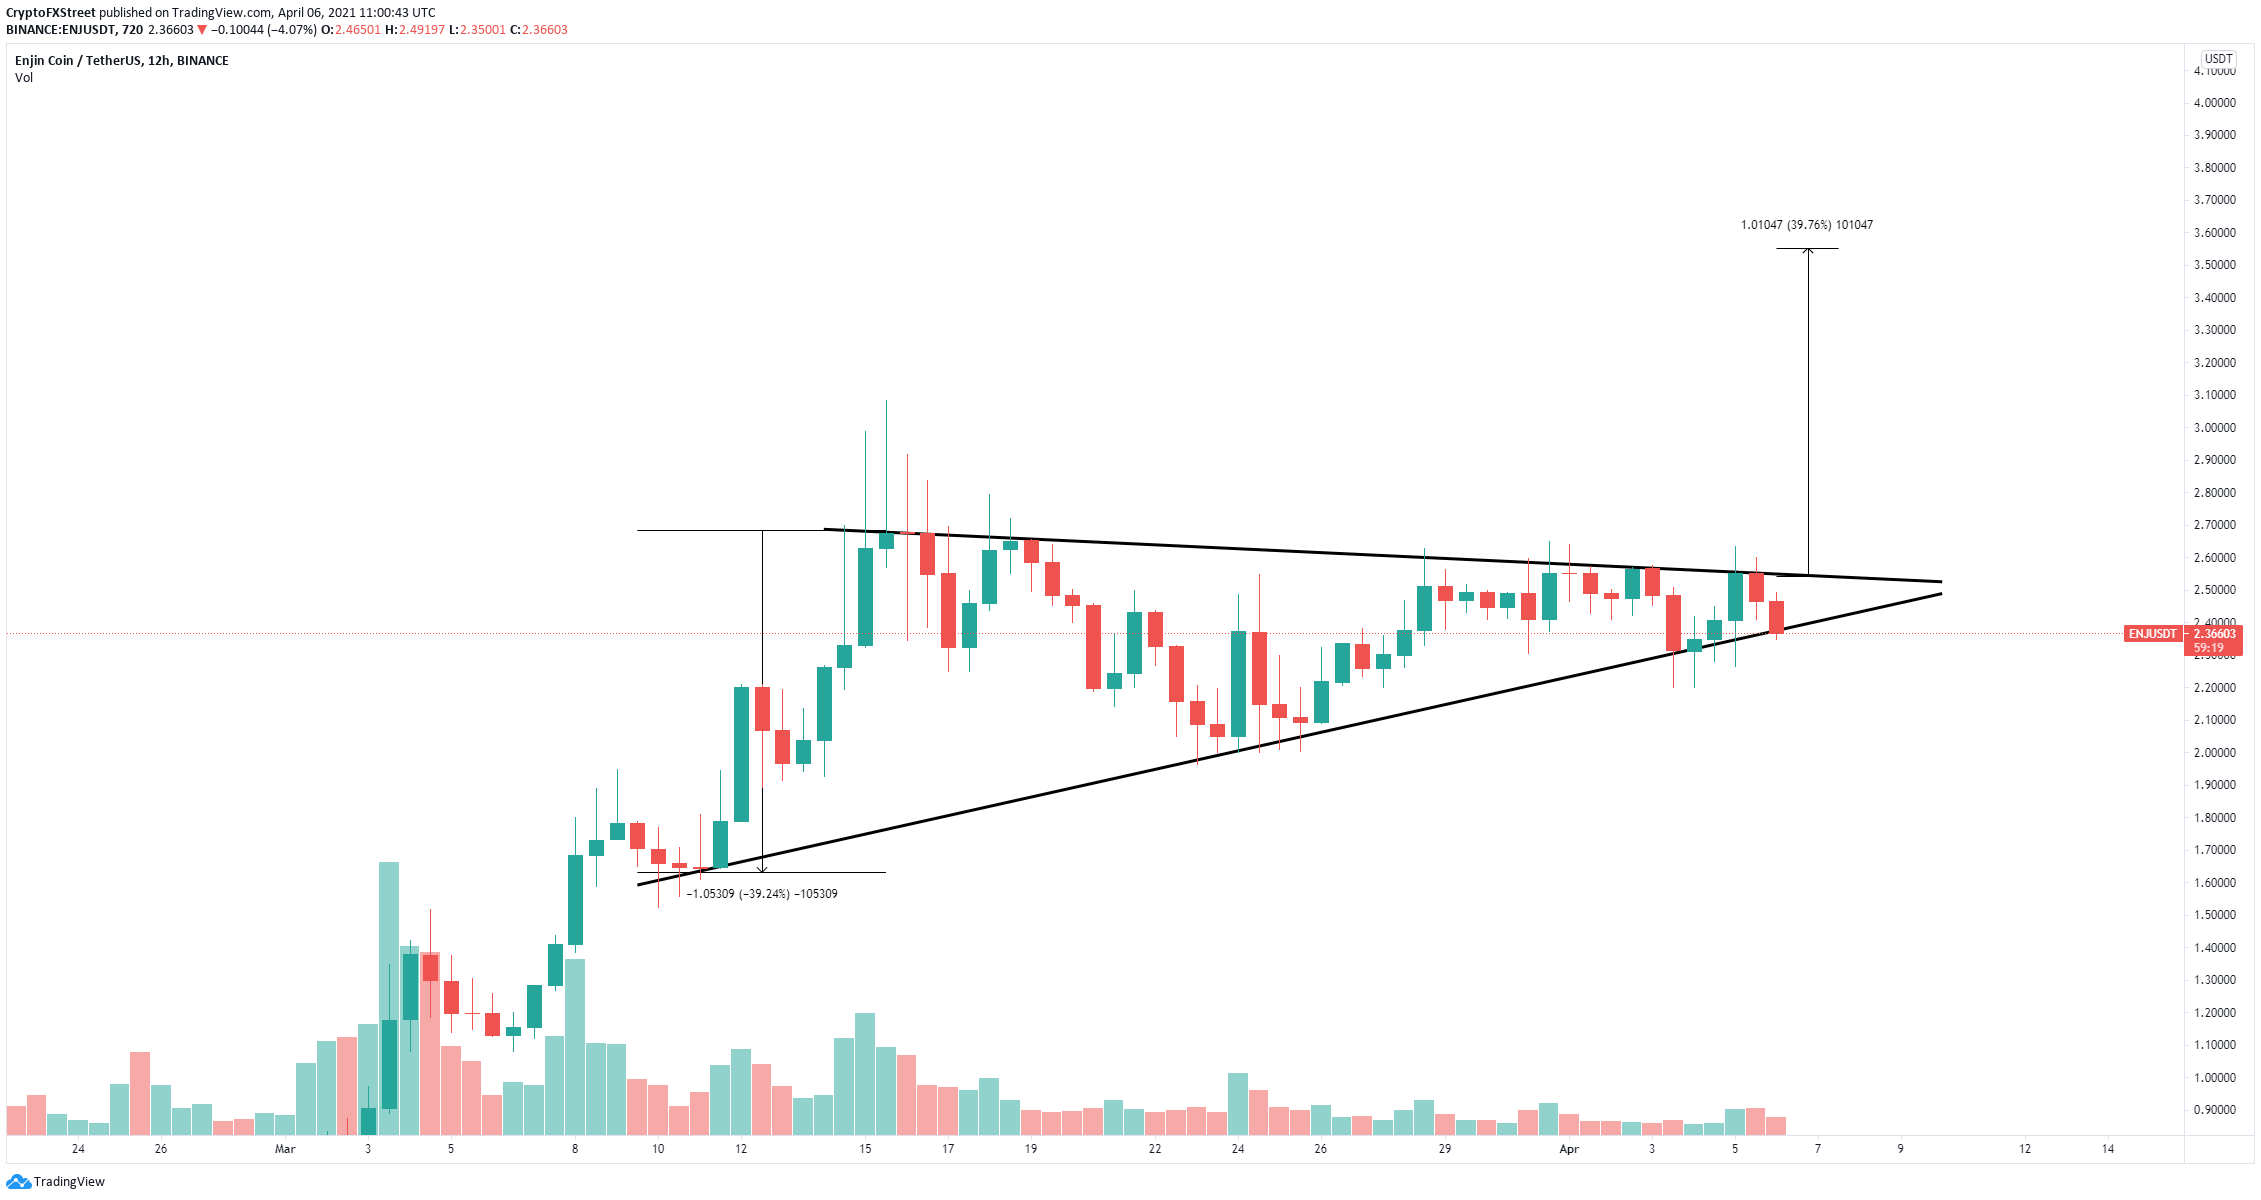
On the 12-hour chart, Enjin Coin has formed a symmetrical triangle. This pattern is created by connecting a series of highs and lows using trend lines. The pattern gives us a 40% potential breakout or breakdown for Enjin.
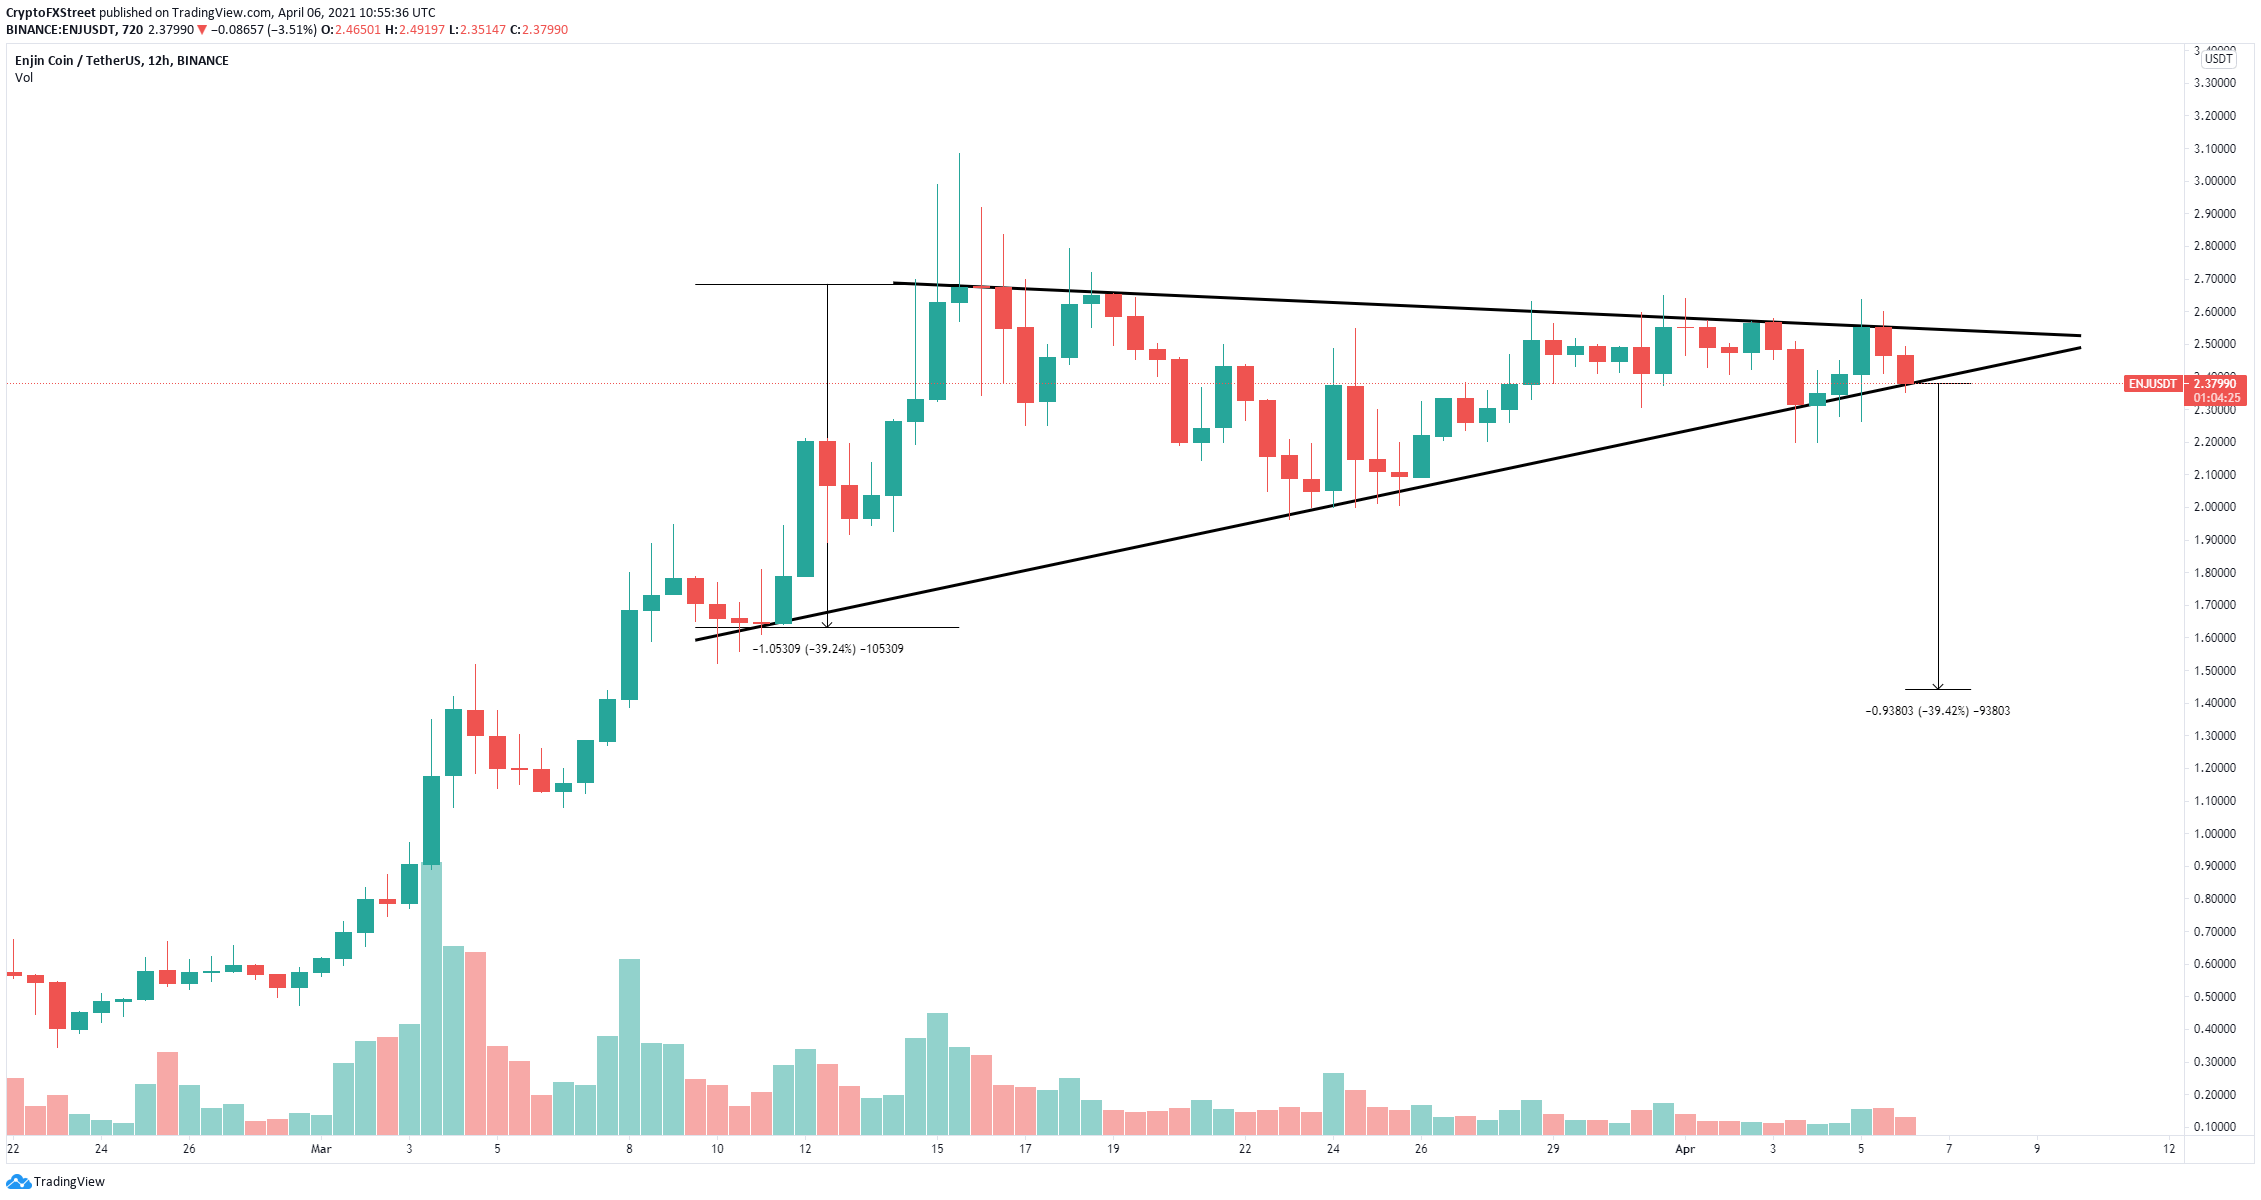
ENJ/USD 12-hour chart
The lower trend line is the support at $2.37. A breakdown below this critical point will drive the Enjin Coin price toward $1.44 in the long term, but the digital asset can pause at $2.2 and $1.96 before reaching its bearish goal.
%20%5B12.58.03,%2006%20Apr,%202021%5D-637533136412626761.png)
ENJ supply on exchanges
Additionally, the supply of ENJ on exchanges has spiked by 1% in the past two days, which indicates investors have deposited ENJ on exchanges, most likely to sell.
%20%5B12.59.43,%2006%20Apr,%202021%5D-637533136789347917.png)
ENJ Holders Distribution
This theory is supported by the fact that whales have exited the network in the past three weeks. Since March 20, the number of large holders with 1,000,000 to 10,000,000 ENJ coins has dropped from 64 to 60 currently.
ENJ/USD daily chart
However, although many on-chain metrics favor the bears, a breakout above the upper resistance trendline of the symmetrical pattern at $2.55 will drive the Enjin Coin price toward $3.55 in the longer term with a first price target of $3.1.
