The entire crypto market is generally in a state of indecision as most assets show a sideways price action. EOS price declined 1.9% over the last 24 hours while trapped in a tight range between $3.54 and $3.75 on the four-hour chart. Bulls struggle to sustain any attempts made for an upward price action. This after exploring lows below $3.60 and help support slightly above $3.54. Movement either way is uncertain as indecision dominates the market.
Similarly, Bitcoin has been trading in a tight range between $31,100 and $32,500 since July 15. Any attempts to push the largest cryptocurrency above is met with immense resistance from the 50-day and 100-day Simple Moving Averages (SMA).
More crypto signals indicate that assets such as Ethereum (ETH), Cardano (ADA), Chainlink (LINK) and Polygon (MATIC) have been showing sideways price actions over the last few days on the four-hour chart.
EOS Price Decreasing Volatility
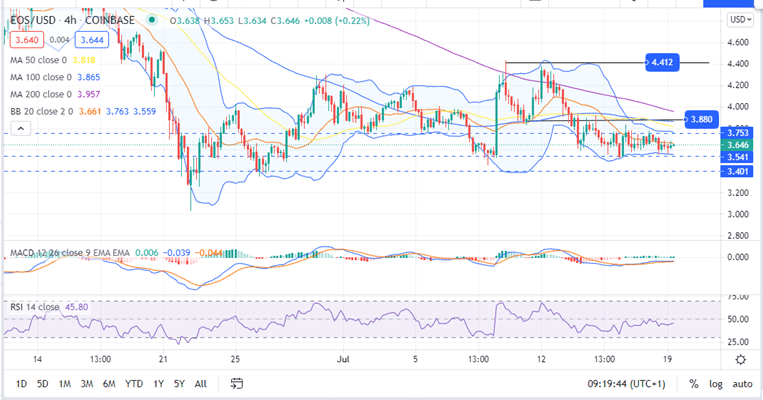
At press time, EOS price teeters at $3.64 on Coinbase. The price of the crypto asset is still drab and 76% below the May 12 high around $14.90. The sluggish price action shown by EOS over the last three days hovers between highs around $3.75 and the $3.54 support level. This suggests that the EOS market is consolidating as overhead pressure and bullish pressure cancel out.
The four-hour Bollinger Band (BB) adds credence to EOS price consolidation. This is shown by the squeezing of the Bollinger Bands towards each other, indicating decreasing price volatility.
Moreover, the Moving Average Convergence Divergence (MACD) indicator validates this price consolidation by its sideways movement. . Similarly, the RSI is moving sideways, an indication that the EOS is in a sideways price action. Furthermore, the RSI is typically in mid-range at around 45.12, which is a show of consolidation of the EOS price.
EOS Price (EOS/USD) Four-Hour Chart
Which Way EOS?
Currently, EOS is trapped between the lower boundary and the middle line of the BB. Realise that a breakout is likely to take place in either direction.
If a downward breakout takes place, EOS price is likely to retest support at $3.50. A further drop downwards could stretch EOS losses towards the $3.40 support zone.
However, if a breakout occurs upwards, EOS price will have to overcome the immediate resistance at around $3.68 before exploring areas around the $3.75 resistance level. Note that any further movement upwards may be hindered by the 50-day SMA.
The MACD also confirms this bullish outlook by its positive above the signal line. The bullish breakout may be validated once the MACD crosses the zero line into the positive region.
New to crypto trading? Our guide on how to buy cryptocurrency is a good start.
Looking to buy or trade EOS now? Invest at eToro!
Capital at risk
