- The price hovering above the green Ichimoku cloud.
- Despite the golden cross, both the Elliott Oscillator and MACD indicator show bearish sentiment.
EOS/USD daily chart
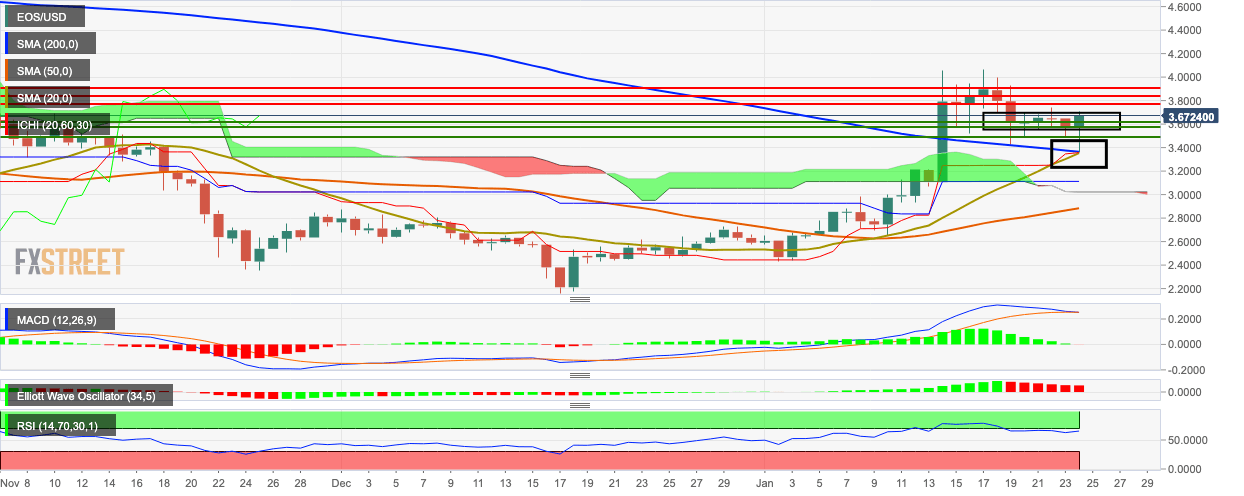
EOS/USD is consolidating in a flag formation in the daily chart and is hovering above the green Ichimoku cloud. The SMA 20 has crossed over with the SMA 200 curve, charting the golden cross pattern. The point of intersection of the two curves acts as support, from which the price went up from $3.57 to $3.68. Even though the golden cross pattern is supposed to be a bullish sign, the MACD and Elliott Oscillator both indicate ongoing bearish sentiment. The MACD shows that market momentum has reversed from bullish to bearish, while the Elliott Oscillator has had six straight red sessions. The RSI indicator has picked up from 62.55 to 65.20, hinting that the price may go up a bit more, before the RSI enters the overbought zone and faces bearish correction.
