- EOS/USD fell from $3.88 to $3.75 this Tuesday.
- Moving average convergence/divergence (MACD) indicator shows increasing bullish momentum.
EOS/USD daily chart
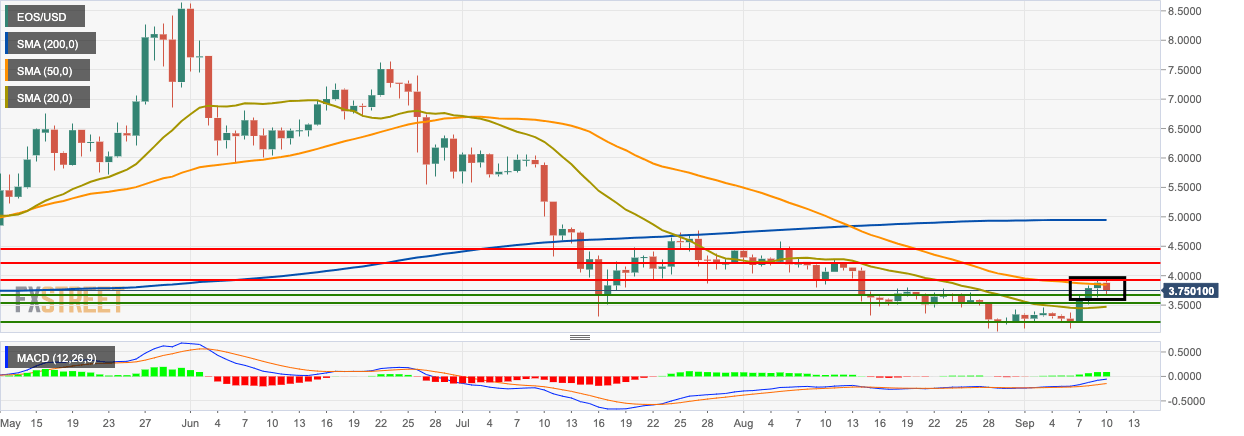
EOS/USD is currently trending in a flag formation and has gone down from $3.88 to $3.75 this Tuesday. While the price is trending above the 20-day simple moving average (SMA 20) but has found resistance at the SMA 50 curve. The moving average convergence/divergence (MACD) indicator shows increasing bullish momentum.
EOS/USD 4-hour chart
-637037536594723782.png)
The 4-hour market has earlier had a bearish breakout from a triangle formation, but it is consolidating once again. The second last session fell below the SMA 20 curve and is trending above the SMA 50 and SMA 200 curves. The relative strength index (RSI) indicator has fallen from the overbought zone to 57.57.
EOS/USD hourly chart
-637037536270653628.png)
The EOS/USD hourly chart fell below the 20-day Bollinger band but has since re-entered it. The price is trending below the SMA 20 curve and the Elliott oscillator has had three straight bullish sessions.
Key Levels
