- EOS was trading marginally within negative territory on Wednesday, after the heavy bought of selling in the prior session.
- EOS/USD consolidation has formed a descending wedge pattern, which could be subject to a breakout north.
The EOS price was seen nursing very minor losses of 0.50% on Wednesday, as price action was in consolidation mode after the heavy selling in the prior session. Soft trading is still seen across the board, with mixed prices for the major altcoins.
Since EOS/USD made another attempt at trying to break down the heavy supply zone, which tracks fresh into the $9 territory, downside pressure has consistently lingered. Each time a relief rally is observed for the bulls, bears pile in to sell those.
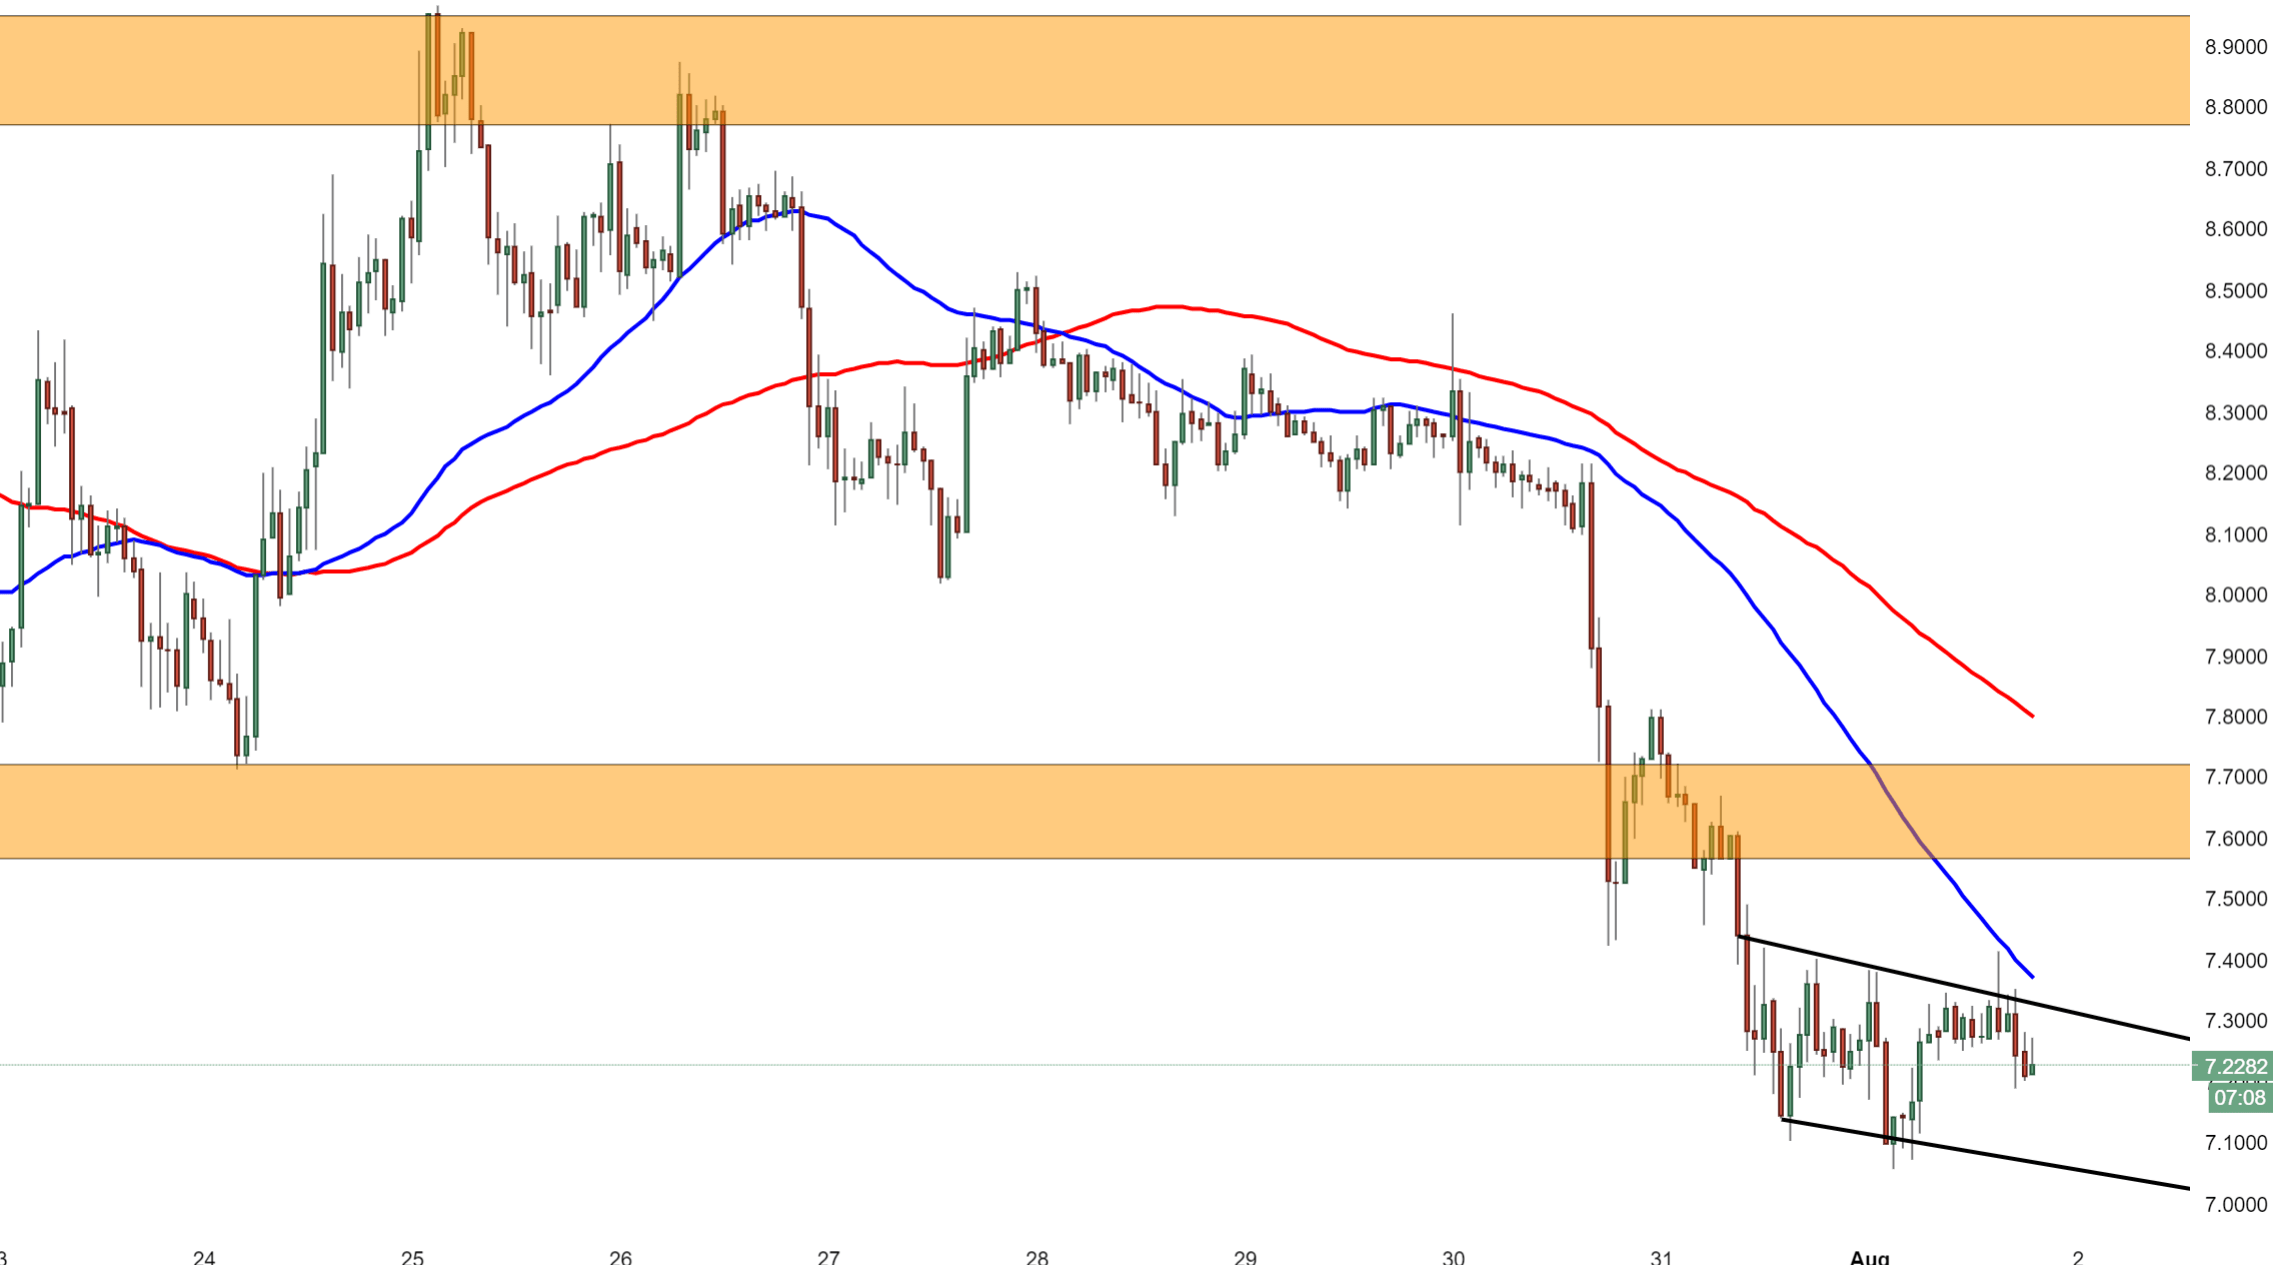
Technically, there may be some short-term upside for EOS/USD, within this period on recent consolidation, price action has formed a descending wedge pattern. By the textbook, a breakout would usually be seen to the upside. EOS is flirting around consolidation levels that were seen on 16thJuly, before a chunky bull run, moving all the way back above $9.00, after coming under pressure.
EOS/USD 60-minute chart