ETC/USD daily chart
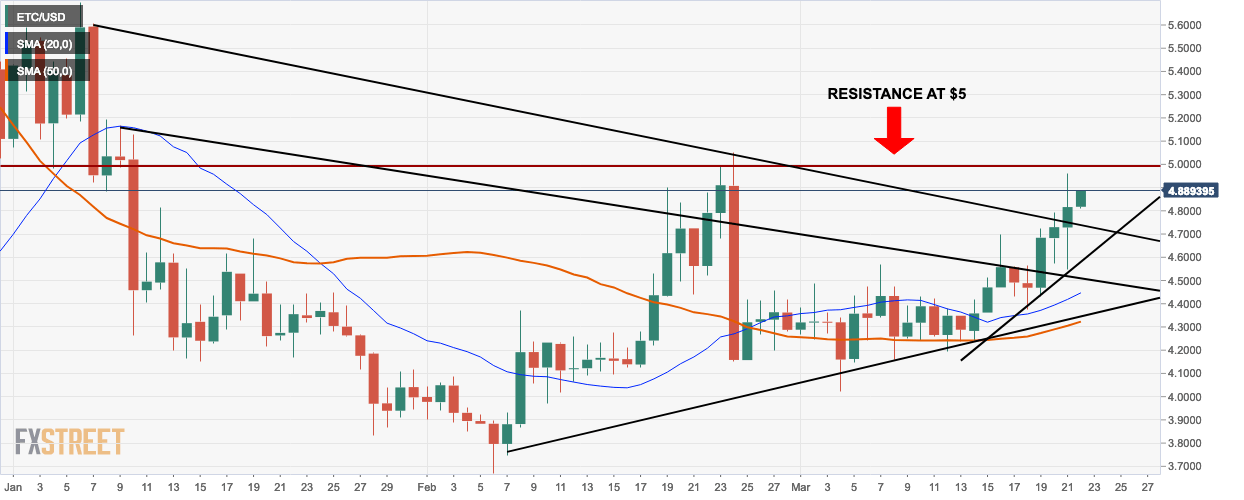
- ETC/USD market opened at $4.89 this Friday.
- The bulls have taken control of the market four days in a row.
- Immediate resistance lies at $5.
- The price is trending above both the 20-day simple moving average (SMA 20) and SMA 50 curves.
ETC/USD 4-hour chart
-636888195202693077.png)
- The 4-hour ETC/USD market is consolidating in a flag formation and is ready for a breakout.
- There was a notable crash four sessions ago, however, the bullish sentiment is so high, that not only did the market recover, but the Elliot wave remained in the bullish territory.
- According to the moving average convergence/divergence (MACD) histogram, the market momentum remains bullish.
ETC/USD hourly chart
-636888195550412641.png)
- The ETC/USD hourly chart shows that there have been multiple times when the bears tried to take control of the market. There is a very notable flash crash as well.
- Each time, the bulls were able to thwart the bears and keep the overall sentiment bullish.
- The relative strength index (RSI) curve is trending between the neutral and overbought zone.
Key Levels
- Resistance3: $5.4136
- Resistance 2: $5.1866
- Resistance 1: $5.0014
- Pivot Point: $4.7744
- Support 1: $4.5892
- Support 2: $4.3622
- Support 3: $4.1770
