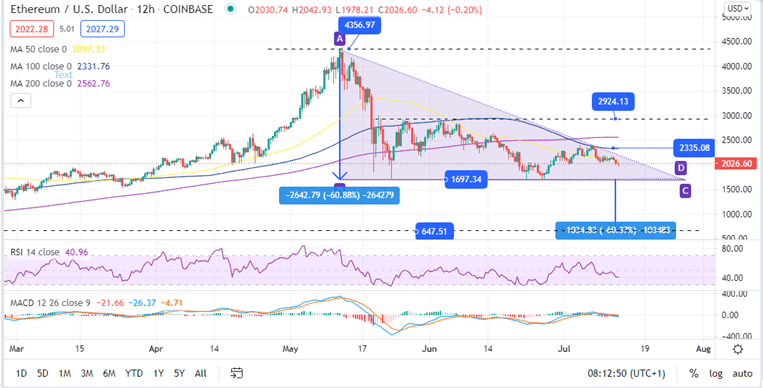
- Ethereum price forms a descending triangle hinting at a decline to below $650
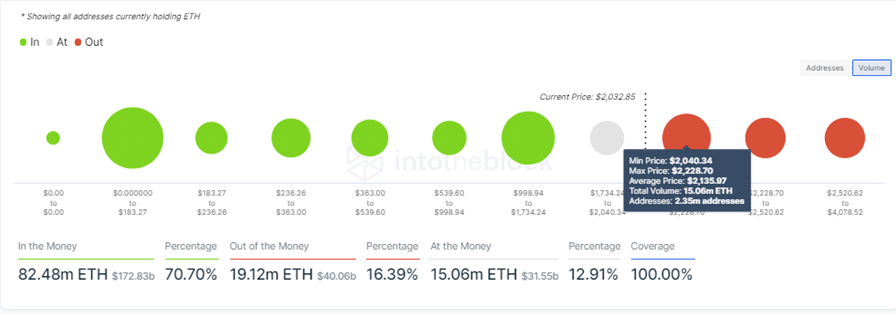
- The IOMAP model by IntoTheBlock reveals massive resistance upwards.
Ethereum price is on the verge of another breakdown following the free fall from the all-time high (ATH) around $4,356 in May. The support at $1,697 has been tested four times giving a bearish technical pattern as the market prepares for the launch of the London Hard Fork.
The Ethereum London Hard Fork is expected to go live on August 4, 2021 which has seen increased demand for ETH over last few weeks. However, this demand appears not to hold up the price of the largest altcoin.
At the time of writing, Ethereum price was at $2,026 while dealing with bearish pressure below the hypotenuse of a descending triangle. Holding above $2,000 has become very crucial for the reversal of the downtrend. Nevertheless, the general technical outlook points to a further drop in ETH price in the near term.
To remain on toes when this happens, join Crypto Signals Telegram Groups to keep with market updates.
Ethereum Price in Freefall as $647 Beckons
The Ethereum price 12-hour chart spells a descending triangle pattern. This technical pattern is majorly considered as a bearish technical tool. However, there are times when it may ebb used to predict a bullish price action.
The descending triangle is drawn by drawing one downtrend line that links a series of lower highs (the hypotenuse) and a horizontal trendline connecting relatively equal lows (acts as x-axis). The horizontal trendline acts as a strong support indicting a strong bullish front.
In this case, the descending trendline indicates that overhead pressure is gradually building up. Eventually, Ethereum price breakout below the hypotenuse is expected confirming the bearish run.
The breakout should occur before the descending trendline and the horizontal trendline converge and should target a distance equal to the triangle’s widest point. For example, if this breakout happens, ETH will likely dump 60% to test support at around $647, which was last seen in January 2021.
Ethereum Price (ETH/USD) 12-Hour Chart
This bearish outlook is validated by the In/Out of the Money Around Price (IOMAP) on-chain model, developed by IntoTheBlock. This On-Chain metric shows that ETH bulls face robust resistance between $2,040 and $2,228.
At this price range, 2.35 million addresses previously bought 15 million ETH. Slicing through this resistance will not be easy for bulls, delaying any anticipated recovery.
Ethereum Price IOMAP Model Highlights Immense Resistance Upwards
Moreover, the Moving Average Convergence Divergence (MACD) accentuates this bearish outlook, as seen on the 12-hour chart. ETH’s downtrend will continue as the MACD moves further
Looking Over the Fence
On the upside, ETH still remains among the best cryptocurrency to buy as the IOMAP model reveals that it currently sits on a relatively strong support areas. An increase in buying pressure may begin the recovery journey past the 50-day SMA towards $2,300 and even explode further to revisit the resistance around $3000.
Looking to buy or trade Ethereum now? Invest at eToro!
Capital at risk
