- ETH/USD has a slow Tuesday as price crawled along at $134.50.
- Further growth seems improbably as per the daily confluence detector.
ETH/USD crawled along at $134.50 this Tuesday. Further growth seems improbable as the daily confluence detector shows that the price is currently stuffed between strong levels of resistance and support. The market had a bearish opening this Wednesday.
ETH/USD daily confluence detector
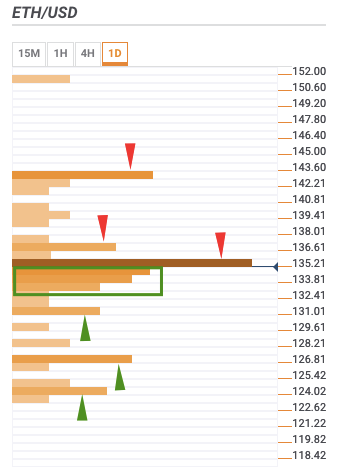
ETH/USD has resistance levels at $136, $137, and $143. The confluences at those levels are:
- $136: 15-min previous high, 10-day simple moving average (SMA 10), 4-hour Bollinger band middle curve, daily 61.8% Fibonacci retracement level, weekly 61.8% Fibonacci retracement level, and 15-min Bollinger band upper curve.
- $137: SMA 5, daily pivot point resistance 1, SMA 100, and hourly Bollinger band upper curve.
- $143: Monthly 28.2% Fibonacci retracement level and weekly pivot point resistance 1.
ETH/USD has support levels at $133-$134, $131.50, $127, and $124.50. The confluences at those levels are:
- $133-$134: Daily 38.2% Fibonacci retracement level, SMA 5, 15-min Bollinger band middle curve, SMA 50, SMA 10, SMA 200, 4-hour previous high, hourly previous high, 15-min previous low, hourly Bollinger band middle curve, hourly previous low, and daily 23.6% Fibonacci retracement level.
- $131.50: 4-hour Bollinger band lower curve, hourly Bollinger band lower band, and weekly 38.2% Fibonacci retracement level.
- $127: Weekly pivot point support 3 and monthly 61.8% Fibonacci retracement level.
- $124.50: Previous week low and daily Bollinger band lower curve.
